WallStFoxy
-
Posts
202 -
Joined
-
Last visited
-
Days Won
3
Content Type
Profiles
Forums
Blogs
Events
Community Tutorials
Store
Everything posted by WallStFoxy
-

Stock market turning points - are we there yet?
WallStFoxy replied to Mercury's topic in Indices and Macro Events
That should just about cover it!! 👿
-
@dmedin For me it's all about my charts. I know lot's of people think SMA is for armatures or not true TA like RSI, MAC-D or Elliots etc. but I have defined my trends so I trust the info. On the pro-real-charts the colours may look strange but they do help identify the trend and they work very well for me. I still miss out on opportunities and close out to early or jump in to early but that's just getting the experience. I started to test my system in April on the Demo and went live in May. By the end of may I was still level in my fund and still learning my system. Improvements over June and July have been good and like I said earlier I have just hit the 100% up level in my fund. So it can be done, just keep working on your charts till you find your trends. 👿
-
@dmedin I don't know what others do but I look for big moves so I only trade max once or twice a day. Today I'm not in at all because I am looking for a sell and the market is rising so I wait for the market to come to me. Take a look at my 15 min chart it shows a down trend below 26,600 so I'm looking for a sell opportunity below 26,600. I could buy the correction but think back to last Thursday when I faded the spike for 423 points, if I had gone long it would have messed with my head so I don't do it. like @Mercury says if in doubt stay out, plus this way I don't worry about is the market going up or is it going down, just when to enter. 👿

-
@dmedin Further to this morning I can now show you how the rest of this morning relates to my script. 👿

-
@Mercury I am sorry I thought it was clear from the text that I was referring to monthly cycles and therefore the Summer Bear is in for August at least. This will be very interesting as I am selling the highs (unless 26,800 is broken) and you are buying the lows, that is the essence of the market and I look forward to seeing how this plays out. 👿
-
@dmedin Sure so would I but by "position Trade" I mean weeks or months. You are more familiar with stocks so may be take a look at the futures prices for Indices and Gold they are much cheaper. 👿
-
@Mercury Not everyone believes in cycles yet since I started back in April we have seen to the day monthly cycles. The first day in April started a bull run. The first day in May started a bear run. The first day in June started started a bull run. July was pretty flat then the first day in August started a bear run so I think the Summer bear I spoke of late in July is here. That said there is always a strong correction in any bear run and I can see potential for 26,500 on Wall St. There is strong resistance at 26,800 so I think that is pivotal for now. I hope you are right about the rally I would love to short 26,600 or higher. 👿

-
@dmedin I guess I should show you what I mean so I took a look at the DAX for you. 👿

-
@dmedin Don't be, Just trust me if you want to trade short term master M15 & M5 even M1 if you can but keep H1 & H4 for long term plans, direction and trends. Identify the main trend ie Wall St. is in a down trend just now so I look for highs to sell (then wait for a sign that it is turning back down) until it turns up then I buy lows in the up trend. That is why you should wait if you want to take a position in Gold, I would never buy the high but wait for a dip and enter as it turns back up this way you have a reasonable stop loss position. It is always best if you decide before you enter if you are day trading or taking a position because if you want to take a position you need a futures contract not a DFB. I don't open a trade every day but wait until the market appears to be doing what I expect it to. Many people over trade because they feel they need to be in the market all the time then end up chasing losses. You have said that Indices are unpredictable but they are far more predictable than you realise. When you follow them every day you should note previous day close (24:00) overnight highs and overnight lows Pivot R1, R2 ,R3, S1, S2, S3 then you will learn how they behave at the open often testing highs and lows before they move for R1 or S1 and the times they move are very predictable. There is often a correction of the overnight move that starts around 06:00. There is often a move on the Dax at the open 07:00 to test either the previous day close or the overnight high or low. there is often a move at 08:00 as the FTSE opens, this for me is the start of the day and 08:00 to 09:30 can be good for nimble traders as the highs and lows get tested. 09:30 to 11:00 is normally more settled and a move for R1 or S1 is likely. This is followed by a pause until around 12:00 to 13:00 then a second move often takes place to R2, S2 or pull back to test earlier Support or Resistance then everything waits for Wall St. to open. This is a bit of a lottery because wall St. can drive the market mad or just run like crazy but if its mad volatile it normally settles down between 17:00 and 19:00 and runs steady to 21:30 or 22:00. This is a lot to take in I know and it only guides the day but study the markets (Dax, Wall St. and FTSE) with this in mind and within a short time you should see what I mean. Most beginners have lost enough before 19:00 packed up and gone but its the easiest most reliable time to trade but be warned don't make the mistake of thinking every pull back will be a reversal that's a novice mistake. This is how I work no RSI no MAC-D just SMA, Support, Resistance, a little bit of trend lines on H4 only and a feel for how the markets work. I'm not saying all the other stuff is trash but I have no need for it. P.S. I just pass the 100% up on my fund. All The Best. 👿
-
@dmedin I know they say don't use short term charts but for me you can't use long term charts for short term trades it doesn't make any sense. Wall St. has been a peach today I got 200 points in just a couple of hours. Take a look at the m1 chart and you see how easy it was. 👿

-
Is trading indices better than trading stocks?
WallStFoxy replied to dmedin's topic in Indices and Macro Events
@nit2wynit I have done several charts showing how I trade I even did a walk through on a real trade on the FTSE for @dmedin but you aren't interested in how I trade, only how you think it should be done. 👿 -
Is trading indices better than trading stocks?
WallStFoxy replied to dmedin's topic in Indices and Macro Events
@nit2wynit I am sorry to say you have totally missed my point. One nice day doesn't make it Summer. I don't think it will ever be sustainable. Have you any idea how daft that sounds? You are in total denial. It's not the fact that it oscillates 20 points, it's the randomness of the moves means you will keep getting stopped out and you will keep on finding another reason for it other than your stop is to close. 👿 -
Is trading indices better than trading stocks?
WallStFoxy replied to dmedin's topic in Indices and Macro Events
@nit2wynit I don't think there's anyone on this forum that has a system such as the one you are looking for. I may be wrong but a £5.00 pp trade with a 5 point stop loss or similar, is not a strategy any one here uses as far as I can tell. That is why people keep giving you advise other than that you wish to hear. I fear you are looking for the impossible and worse still, if you don't try to adapt your strategy soon you may be staring at a margin call. I wish you the best with your trading and who knows maybe one day you may be the one giving everybody else advise on how this strategy works but please remember if things go wrong it is not because you didn't get good advise but more you didn't like the advise you were given. 👿 -
Is trading indices better than trading stocks?
WallStFoxy replied to dmedin's topic in Indices and Macro Events
@dmedin For me it's a no-brainer, with Indices you get a much lower spread and greater daily movement compared to trading stocks, so for short term trades the advantage is clear. Many people choose Forex for the same reason but I find there's a more stable trend to trade in Indices making it much easier to understand. If you consider the last 100 years stocks have been a long term bull trend but for the last 10 years in particular Wall St. has been a world leading bull market offering opportunities for both day traders and trend followers so why spend hours trawling stocks looking for less profitable options than the obvious opportunities before you. 👿 -
Is trading indices better than trading stocks?
WallStFoxy replied to dmedin's topic in Indices and Macro Events
@Nelsy-Boy I get that trading is a very personal thing, Its taken me years to work out my own strategy but I still keep finding ways to improve. I would think H4 will help but if not nothing lost keep going with D1. I wish you all the best with your trading. 👿 -
Is trading indices better than trading stocks?
WallStFoxy replied to dmedin's topic in Indices and Macro Events
@Nelsy-Boy It sounds like you have a plan that works but I would urge you to swap your Daily charts for H4 charts at the max, if you try them both at first you will see the advantage. 👿 Daily Chart: H4 Chart: H1 Chart: I could go on but these three charts are exactly the same just different time frames, I know which one I would use!! I would also wait until 09:30 - 10:00 unless I had Already made a move at 06:30- 07:00 because I move either before the European open or after the u.k. open settles down. If you have limited time you could try waiting until about 18:00 or 20:00 there is very often a big move late in day due to Wall St. 👿 -
@nit2wynit I'm counting on it. I'm looking for about 27000 with a bit of luck then sell again. I rarely trade against the trend so I will wait for a nice high to sell. Today I am not trading just chilling out then I will take a fresh look on Monday. 👿
-
@nit2wynit There's no such thing, everything affects everything else in this market. 👿
-
FWIW my H4 chart for Wall St. looks to be in a confirmed down trend. For now it's going to be a sell the highs sort of trade. 👿
-
@Caseynotes @nit2wynit @TrendFollower Thank you all, it would seem I'm the only one who didn't understand the acronym so now I understand, thanks again. 👿
-
@Caseynotes Firstly can I ask what a FOMOer is? and secondly are you simply saying sell the highs not the the lows?
-
@nit2wynit Hope so, you've put the work in!! 👿
-
@nit2wynit I just shorted wall st. then went to the shop, when I got back I was 423 point up. I closed out 'n' now havin a beer. 👿
-
@nit2wynit 12:00 High UNITED KINGDOM-BOE RATE DECISION - BOE BANK RATE Aug. 2019 0.75% 0.75% 0.75% 13:30 High UNITED STATES-JOBLESS CLAIMS - INITIAL CLAIMS w/o Jul. 22, 2019 214 k 206 k – 15:00 High US ISM Manufacturing PMI Jul. 2019 52 51.7 – 15:00 High US ISM Prices Paid
-
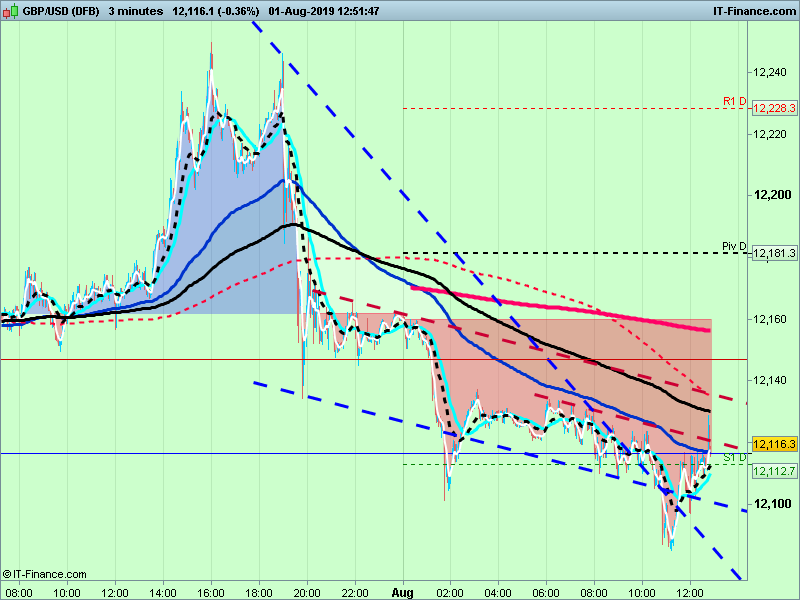
Options analysis - are we missing out?
WallStFoxy replied to dmedin's topic in General Trading Strategy Discussion
@dmedin Yep, it turned back down. 👿