

WallStFoxy
-
Posts
202 -
Joined
-
Last visited
-
Days Won
3
Content Type
Profiles
Forums
Blogs
Events
Community Tutorials
Store
Everything posted by WallStFoxy
-
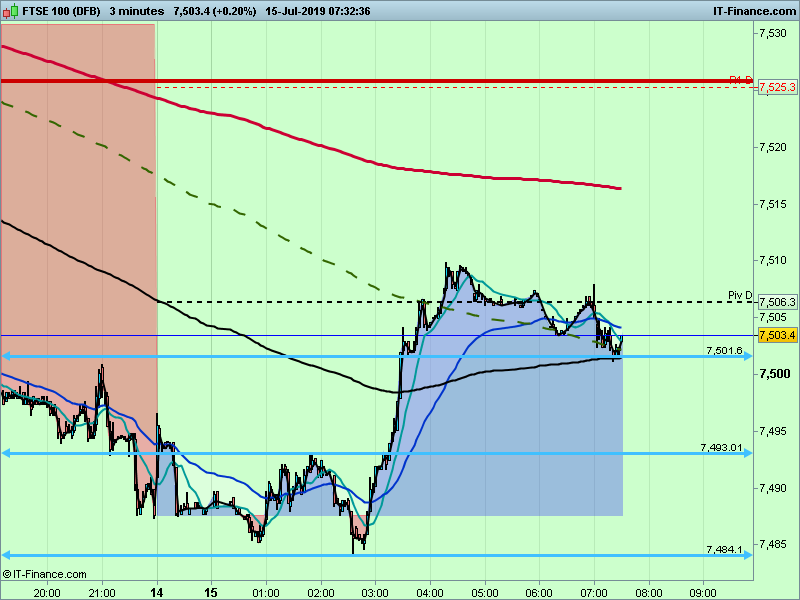
@dmedin It's now just gone 07:30 and the FTSE has just tested 7500, it could go down to test 7493 as you can see on my chart but 08:00 could bring a rapid rally so if I wanted to trade this long I could buy now with a close stop just under 7500 or use a buy order just above 7510, personally I would choose the former because even it it reaches 7510 it could still test 7493. 👿
-

-
@Caseynotes Thanks for that, I've been looking for a sub heading for sectors, I feel a bit daft now. 👿
-
@dmedin Charts only show you what has happened, from that you have to analyse the most likely event going forward and to do that you need to understand how the markets work. There will always be at least two out comes and most often there are three, many traders only think in terms of up or down forgetting the sideways move yet in the middle there is almost always a sideways move if only for a day or two, this is the turning point. It may be a huge spike but that will retrace around 50% or more, it may be a series of failed attempts but you can see it in the charts. The most important thing to me is understanding the difference between a pull back in the trend and the trend itself. When you expect the market to do something you can wait for the market to come to you. I am going to show you on the FTSE chart over this week what I mean, starting now. This H4 chart shows me 3 things, firstly the FTSE is in an up trend, secondly the FTSE is pulling back or retracing the previous rally (caused by trumps reversal at the G20) and thirdly it shows me two probable points for reversal (levels of support) if you wanted to go short here you would need to scalp inter-day on an M1 or M5 chart, because although it's going down it's expected to reverse, given you would want to hold your trade it looks like you would be better off buying a low. Sorry it's a bit long winded but you wanted a thought process. 👿 FTSE H4 Chart Below is the FTSE last Friday on an M5 chart ( I wish I was trading that and not the Dax last Friday) you can see it has reached the first level of support so we wait and see what happens Sunday night. If this turns up over Sunday/Monday we could use the low as a stop-loss in case I am wrong. I will follow this up for you tomorrow. 👿 FTSE M5 Chart
-
@Mercury Can you still trade sectors on IG, I can find them in the listings?
-
I don't know but I do know that historically BATS has been the most bullish trend I ever saw so I wouldn't sell this one so low in it's history. 👿

-

TA - Technical Analysis
WallStFoxy replied to Caseynotes's topic in General Trading Strategy Discussion
Ok I can tell you that, if you trade equities they are bullish 70% of the time i.e. don't look for highs to sell look for lows to buy and you increase your odds dramatically, it cost me £30,000 and 10 years to discover that is more important than anything you will find on the net!!!!! 👿 -
TA - Technical Analysis
WallStFoxy replied to Caseynotes's topic in General Trading Strategy Discussion
So why are you here? 👿 -
TA - Technical Analysis
WallStFoxy replied to Caseynotes's topic in General Trading Strategy Discussion
I guess most people that want to trade do some research, mainly the free information available on the internet yet around 80% of these traders fail, so either 80% of the traders are fools or the information they are reading is foolish, I do not believe 80% of the people are fools so I conclude that most of the information out there, free or otherwise is of limited use. You need to understand what you are doing and that you do it a virtual world, consider if you would do this in the real world at the real cost of a trade. £1.00 pp is equivalent to 100 shares i.e. 100 shares rise by £0.01 and you make £1.00 if the price of a share/unit or indices is say 7500 that is £75.00 per share or unit so £1.00 pp is equal to 100 x £75.00 or £7,500 therefore if you trade say the FTSE @ around 7500 just £1.00 pp is £7, 500 and £10 pp is £75,000, £20 pp is £150,000 I would assume if you bought an asset for £75,000 you would be expecting it to rise in value but would you really sell it if it went down by £20 or even £50 no I am sure you wouldn't, so what I am trying to say is keep it real and understand what you are doing in this virtual world and it will help to keep you safe. 👿 -
@dmedin I know you don't like short term charts but why not try the H4 charts they are 6 times more informative than Daily charts. 👿

-
Wall St. is getting close to 27000 again and the Dax is lagging well behind. I expected a strong rally this morning especially with the FTSE looking bullish but that's not happened yet so here's my worry: 13:30 High UNITED STATES-JOBLESS CLAIMS - INITIAL CLAIMS If this is a bad print Wall St could reverse yesterdays spike in a flash and we could see the Dax heading for 12250. 👿 Wall St. H1 Dax H4
-
@Mercury In the longer term I see resistance above @ $66.65 that could be pivotal, you can see the support @ $63.65 looks more significant on the Daily chart. 👿
-
WOW S&P TAGS 3000
-
@dmedin Inter-day chart not looking good on JD, it has bounced off £6.00 and the FTSE looks like it wants to recover. 👿

-
The Dax has just tagged yesterdays low and could now make an attempt at this mornings high. 👿
-
@dmedin Tomorrow may be a better day to see how things are going, if it drops below £6.00 it could keep on going down but above £6.15 and I would be getting worried if I was short. 👿

-
@Mercury I love your Elliot waves they sound so technical but I see strong support @ $63.65 and support from the 30dma and vector support. It looks to me like the bears have tried to push oil back into a downward trajectory and failed, as long as $63.65 holds this continues to be Bullish for me. 👿
-
@dmedin Well played, you did right to bail. Those big buys may make big losses tomorrow. JD has also come back for you 👿

-
OK but again no use if you wanted to trade 2011/2012 or 2015/2016 or 2018/2019 and was waiting for a continuation pattern on the world equity markets chart. Its just another pretty pattern. 👿
-
OK but during that same period horizontal support and resistance would have served you better as you can see from my weekly chart of the same period .
-
This goes to show that a head and shoulders pattern has no meaning at all just the support and resistance lines associated with it. 👿
-
@dmedin Take a look at the daily chart, I would suggest holding off on going long until you have a clear breakout but of-course it's your choice. You should have either closed out or opened a hedge on your trade after you saw strong support at £576 and the averages turning up but if you didn't you will have to be careful you don't start compounding you errors, it's very easy to do that. Also remember if the FTSE goes down it is unlikely that JD will go up so keep an eye on the FTSE. This chart doesn't support a short position but it doesn't support a long position either. At this point it may be worth considering a stop loss just above £636 with a target of £520. That would be called selling resistance and targeting support, it may not work out but it is a professional and valid strategy. The choice is yours, I only say this because I read a post of your that said two heads are better than one. Good Luck. 👿

-
@Valentin Gold Is Heading For $1250 Well that is my opinion, and here is why: Gold has had a great run so far this year but there is good reason to suspect we may have topped out. Here I will show you that this bull run didn't start in August 2018 but in fact started in November 2015. Since then it has been in an ascending channel or bullish channel of which we are now at the top edge. Looking back at previous times when we reach the upper edge of this channel we saw several weeks of consolidation before a retreat to the lower edge of the channel. A break out above 1450 can't be ruled out and would negate this analysis but otherwise the best play in my book would be to sell highs until this is proved wrong.
-
@TrendFollower Yet again you are disrespecting people because you don't understand their system, as I pointed out to you in the Gold thread this morning (just before it fell through the floor) going short at resistance is a valid strategy, the same is true for wall st. Many traders will sell resistance and buy support especially at the top/bottom of a range or channel. The recent ATH on wall st. was a clear resistance level and very likely to be sold off and a valid strategy, indicator or signal to go short for a swing trader (the proof of which you have witnessed today). If wall st falls to 23350ish that would be a great swing trade if it makes a sharp turn back up and continues to rally then the trend trader wins, for now we have to wait and see but trend following not always the best and certainly is not the only strategy to trade, so please stop disrespecting other people just because they aren't trend followers. DJI Monthly, Range from 2017
-
@TrendFollower Take a second look at your chart, we have strong resistance from the weekly chart with a double top on the H1 and the inter-day trend is weak. I think a re run of last week could be on the cards unless there is a rally later on today.


