

PirateRadio
-
Posts
42 -
Joined
-
Last visited
-
Days Won
4
Content Type
Profiles
Forums
Blogs
Events
Community Tutorials
Store
Posts posted by PirateRadio
-
-
It is likely to find the same charts and analytical tools on every platform (except time which is a very important tool for those trading large amounts with high leverage, while analytical tools are offered according to the trading time sequences and markets existing on the platform) , the maximum control over the trades is not always possible, there are factors that no platform can control for the best trading experience, lagging is one of them, then a slow computer and finally algorithms that may respond to early or to late to a buy/ sell order. Unfortunately I cannot share the same opinion and orientation with you, the education provided by institutions and publishers hasn't been applied or even respected in my professional career or trading and investing part-time job, so I decided to follow my own theories, instincts and developed 'courses, studies and real experiences' (not in the professional side which is supported by many many years).
I do have an own explanation for markets available to trade in pre and after hours trading sessions, but not for all the others available at the same time especially when the change or the difference occurs in the middle of the trading session.
Regards
-
The noise generated by an Antminer is about 80db which is considered relatively high, or according the web and other ENT specialists: A whisper is about 30 dB, regular talk is about 60 dB, and it is about 95 dB for a motorcycle engine to operate. Noise over 70 dB can start to affect your hearing for an extended period of time. Loud noise above 120 dB will damage your ears instantly.
Perhaps it is not a good idea to use it at home!
-
And I also appreciate if someone would detail the fees, one of the open positions reached the SL and the balance shows a different amount after deducting the SL amount.
-
Hi, I was just wondering, how is it possible the same charts, same indicators, same trend , same time frame, same instrument analysed looks different on a different trading platform, I can understand there is a time difference and trading availability, but how is that possible in the middle of the session? Like for instant the RSI 95 vs 77, shorter MA crosses longer vs Parallel MA's on a different chart?! Thanks
-
Most likely the value of investments as on the day (probably Friday) will be cashed out, then could probably everyone can start investing in Haleon.
Heard it yesterday on the Metro in French, not sure if understood correctly, but it seemed that had strong roots and knowledge about chemistry and personal hygiene, brands, development, expansion, mergers and acquiring.
-
Natural Gas remains 'the monster of the monsters', it requires no leverage and a lot of patience: lately formed a triple bottom, likely to test a previous support at 6400 and higher, it is a challenge for for those preferring CFD trading, especially for professionals trading high leverage! Otherwise can double, triple or more the equity and wipe out the account as well in a short period of time. It has no limits or previous time to count on, on any chart available! During the good days CAN tumble or spike up 7 -8% in a matter of seconds! IG remains the best for challenging the Natural Gas financial instrument!
-
 1
1
-
-
On 21/06/2022 at 15:56, RomPathsSwap said:
Both pairs presenting a Head and Shoulder and an inverted Head and Shoulder pattern are likely to have a small correction during the next 24 hours, however on the long haul the uptrend remains unchanged. Not a financial advice, just a trading idea share, feel free to correct or adjust!
One good shot! Just one more to go...
-
 1
1
-
-
7 minutes ago, MongiIG said:
Thanks for sharing @RomPathsSwap
Buying or selling GBP/USD and CAD/JPY what are you predicting for both these trades?
All the best - MongiIG
Both pairs presenting a Head and Shoulder and an inverted Head and Shoulder pattern are likely to have a small correction during the next 24 hours, however on the long haul the uptrend remains unchanged. Not a financial advice, just a trading idea share, feel free to correct or adjust!
-
 1
1
-
-
Perhaps, once in a while opportunity! Some of the best patterns to trade!


-
1
-
-
On 15/06/2022 at 09:52, Hustler said:
ASX200 will enter a "steadying" phase as of tororrow (16/6/22). This will be an opportunity to chance a preemptive trade provided it's done at a very low price.
No entry signal present though.It's likely to continue its downtrend as a 'long term' trading idea...
_20220618_23_55.thumb.png.ce9a76995c71b777396308933148fa7c.png)
-
3 hours ago, phillo said:
got there

The entry point is also important...I noticed you preferred it earlier today or however at a lower value! Thanks

-
9 hours ago, phillo said:

Tonight lower...maybe...
-
1 hour ago, MongiIG said:
Broadening wedge pattern forming ? Triple bottom ?
It is going to be interesting to see how the dollar will react later today during the Fed interest decision.
All the best - MongiIG
Yes and the speech after the announcement is also very important.
-
1
-
-
22 hours ago, MongiIG said:
US DOLLAR TALKING POINTS:
- The US Dollar set a fresh 20-year high yesterday with another topside test of the 105 psychological level.
- Today marks the start of the two-day FOMC meeting with tomorrow bringing the accompanying rate decision and press conference. Making the rounds yesterday was a Wall Street Journal report indicating that 75 basis point hike may be on the table for tomorrow and this had a noticeable impact on markets, the USD included.
- The analysis contained in article relies on price action and chart formations. To learn more about price action or chart patterns, check out our DailyFX Education section.

This theme certainly has taken its time. It was late last November when Chair Powell had moved to retire the word ‘transitory’ as it had become evident that inflation wasn’t going to just go away on its own. At the time, the most recent CPI print had come in at a whopping 6.8%, continuing the trend that was evident throughout the year. The Fed continually dismissed this as being related to supply chain disruptions, which were related to Covid; and despite the fact that CPI had crossed 5% in May the bank was still harboring hope that things would just correct themselves without the Fed needing to pull away the punch bowl.
But, as the end of Powell’s first term drew near the head of the FOMC all-of-the-sudden had a change-of-heart about the matter, and started talking about the need to address inflation.
This was seven months ago, and at this point the Fed has hiked rates on two separate occasions for a total of 75 basis points. Inflation, at this point, has shown little responsiveness as we just saw another 40-year-high print on CPI last Friday.
On the FX front, there was another item of interest late last week that continues to produce some impact and that was the European Central Bank rate decision. The ECB is facing a similar problem as the Fed last year, with Euro-area inflation climbing above 8%. So at last week’s rate decision the expectation was that the ECB would start to shift their stance towards fighting that inflation, to some degree, to avoid falling into the same position that the Fed finds itself this year. But the ECB didn’t really sound too hawkish, instead highlighting a 25 basis point hike in July which may be followed by a 50 bp move in September; neither of which seem very likely to arrest the inflation that’s already showing in the economy.
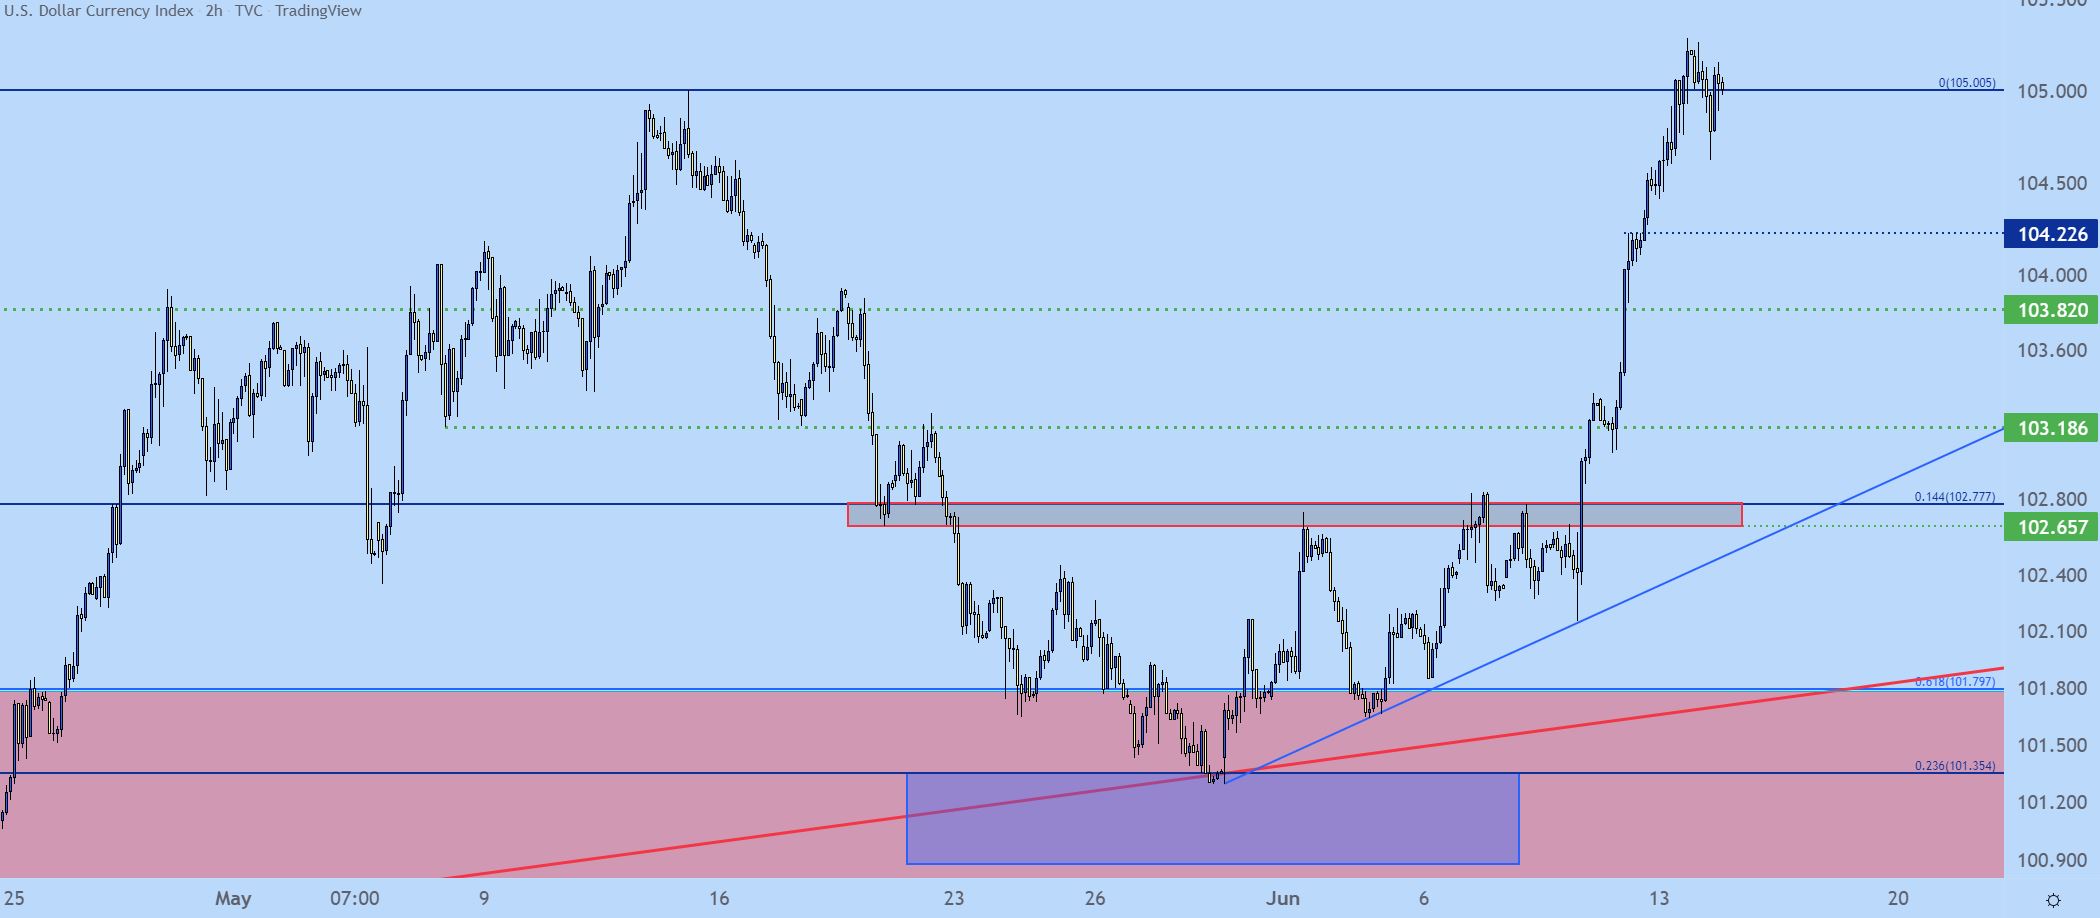
The response there was significant. The Euro began to drop and the US Dollar surged-higher, breaking out of an ascending triangle formation that I had talked about just after the rate decision had completed.
That formation filled in and buyers continued to press the bid through Monday trade, helping the Greenback to set another fresh 20-year high in yesterday’s session.
US DOLLAR TWO-HOUR PRICE CHART

Chart prepared by James Stanley; USD, DXY on Tradingview
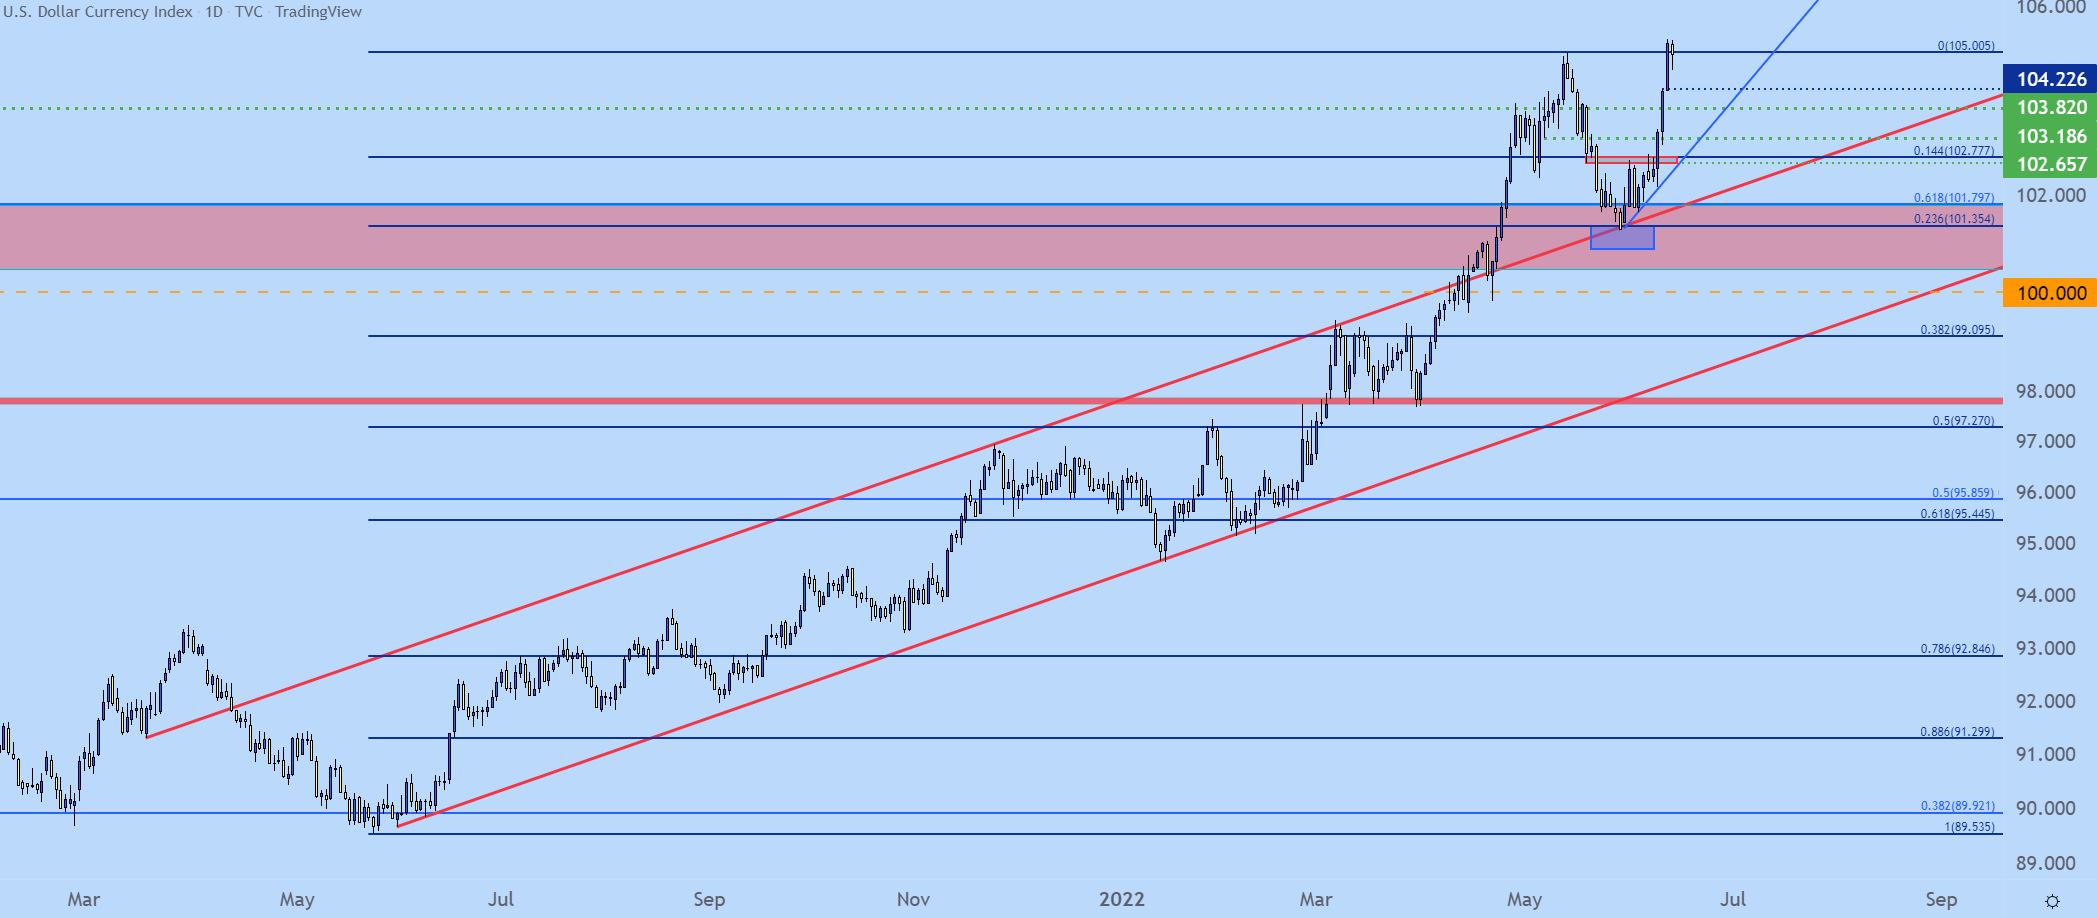
US DOLLAR LONGER-TERM
Taking a step back to the daily chart and we can see USD perched at this fresh high with only a minimum of pullback so far.
US DOLLAR DAILY PRICE CHART
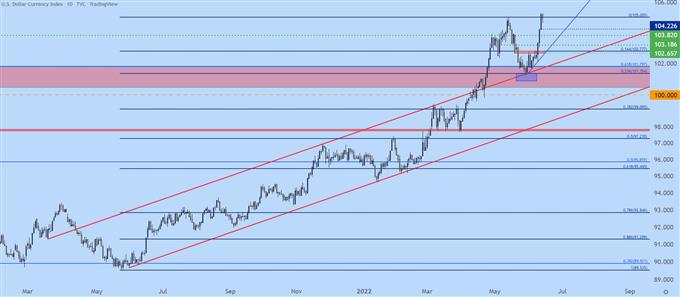
Chart prepared by James Stanley; USD, DXY on Tradingview
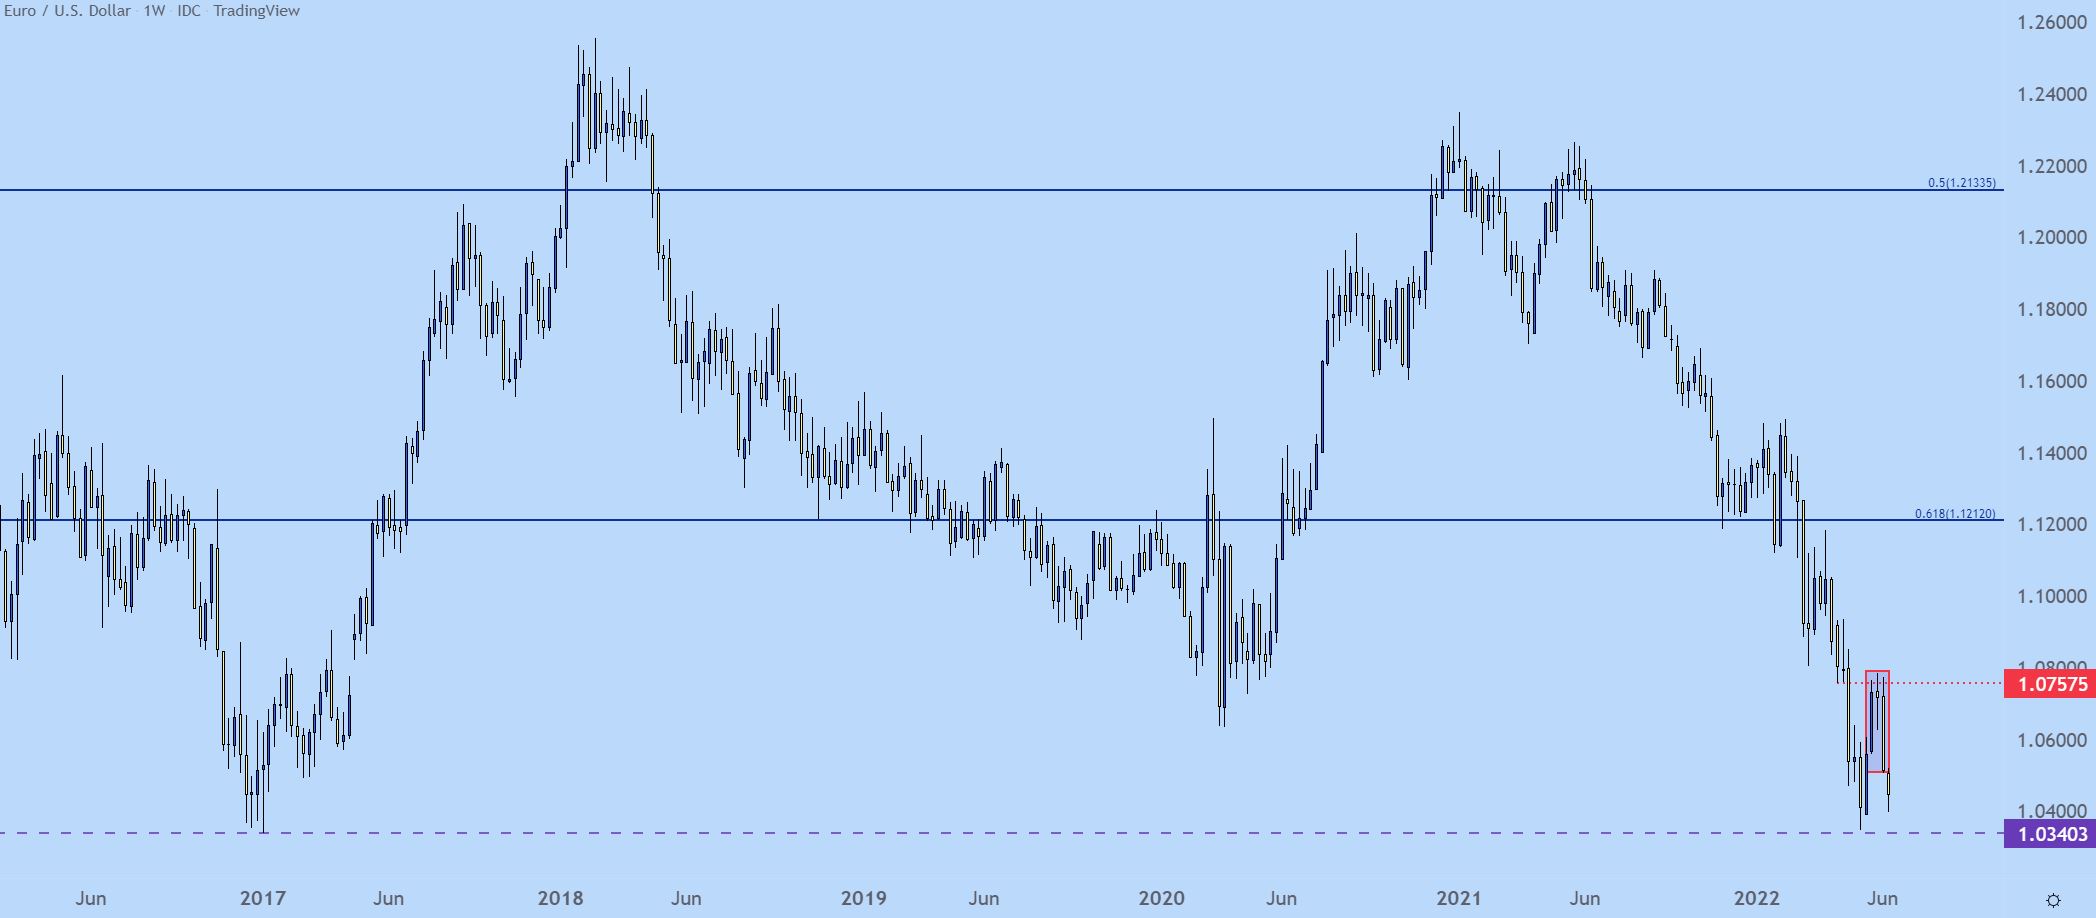
EUR/USD
For traders that are plotting breakout continuation in USD, they’re likely also looking for continued breakdown in EUR/USD.
That ECB rate decision brought the bears into the matter as it became apparent that the bank wasn’t yet ready to kick into a more-hawkish gear to fight off inflation. And there are other risks, as well, given the ongoing battle in Ukraine which keeps some inflation pressures in the equation regardless, such as with wheat or energy.
There’s already some banks out there calling for parity, as of this morning, which has been a notorious trap in the past on EUR/USD. But, given how quickly bears have come back into the pair, the current 19-year low at 1.0340 seems exposed to breakout potential as we near tomorrow’s FOMC rate decision.
Last week’s candle completed an evening star formation in the pair which is often followed with the aim of bearish reversals. In this case, it would be a reversal of the short-term pullback theme that found resistance around the psychological level of 1.0750.
EUR/USD WEEKLY PRICE CHART
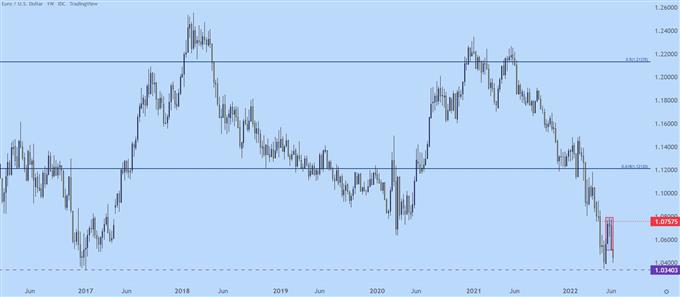
Chart prepared by James Stanley; EURUSD on Tradingview
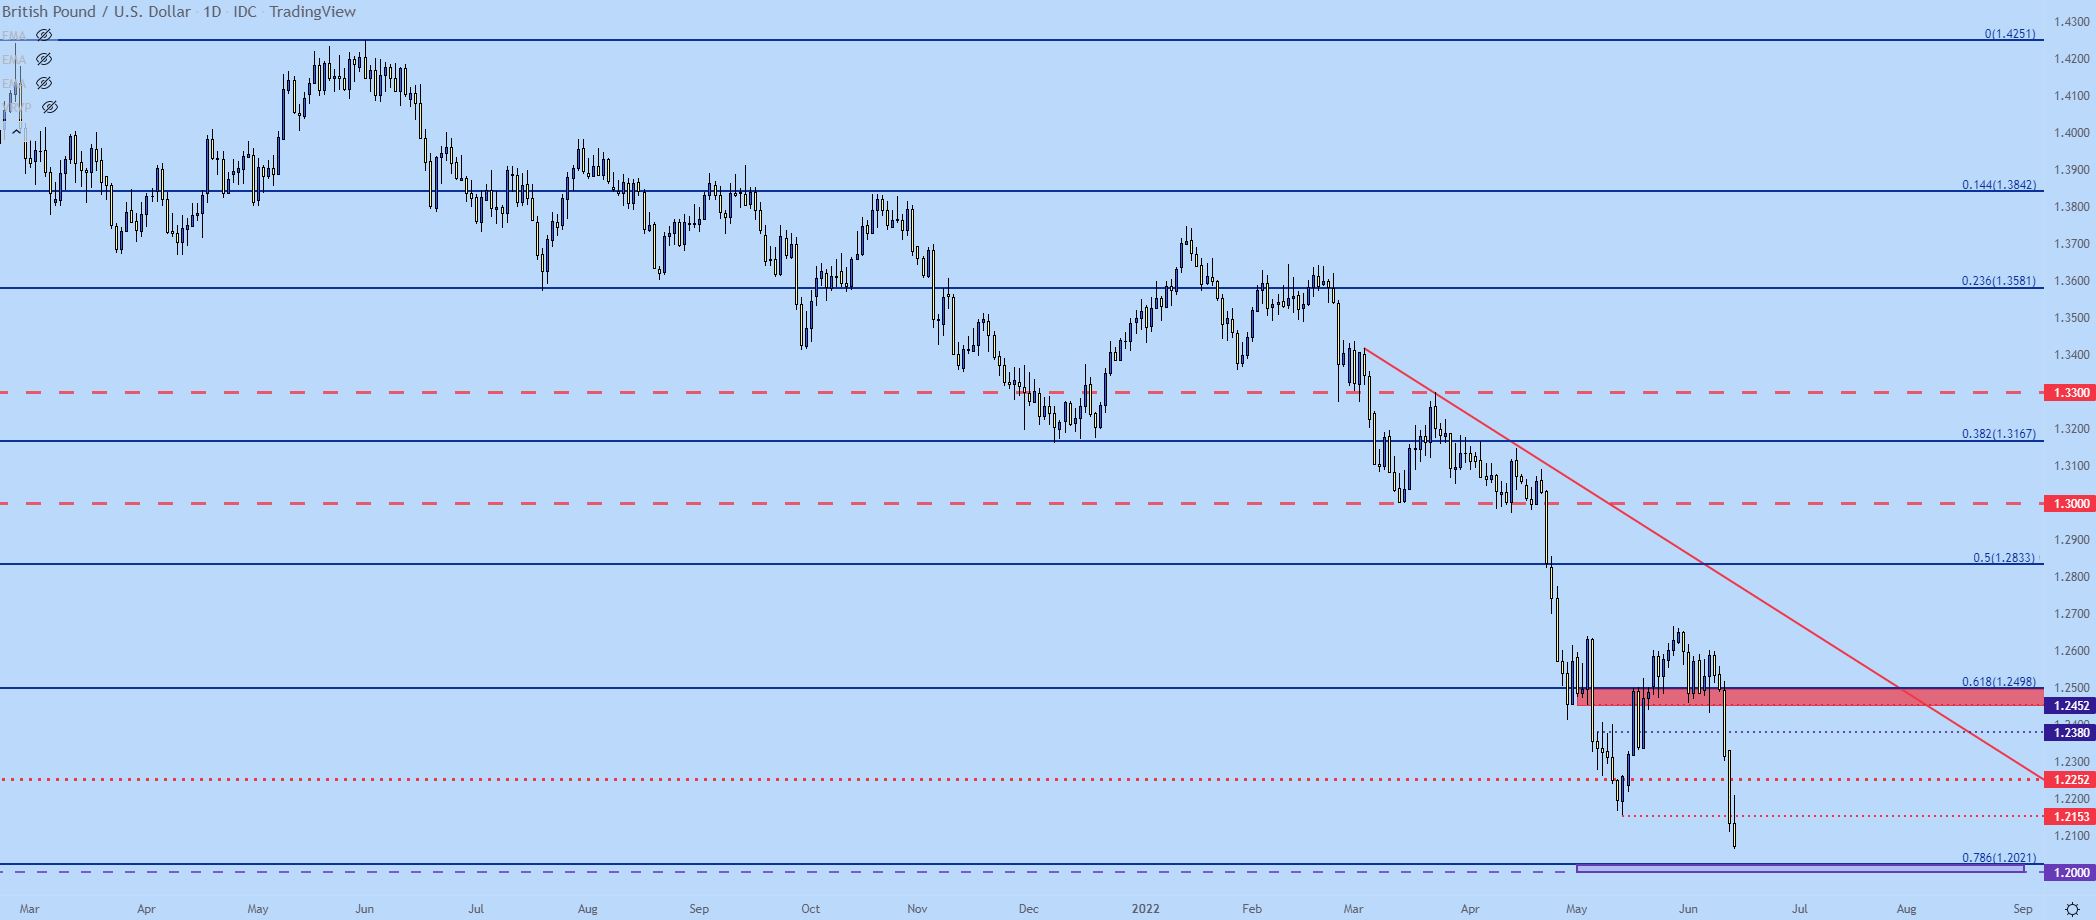
GBP/USD SLICES THROUGH KEY SUPPORT
As I had written ahead of that CPI report last week, GBP/USD had an item of encouragement for bulls in the fact that price had held a spot of support for a couple of weeks prior. That support ran from 1.2452-1.2500.
But as the USD surged on the back of that inflation report GBP/USD plunged through that support zone, and at this point the pair is now trading at fresh two-year-lows, closing in on a test of the 1.2000 psychological level, which is confluent with the 61.8% Fibonacci retracement of the 2020-2021 major move.
At this point price action is the proverbial falling knife. Trying to catch it could prove problematic. But, that confluent zone of support a little lower on the chart may be enough to stem the tide of sellers, which could allow for a short-squeeze/pullback type of scenario.
And, of note, there’s a Bank of England rate decision on the economic calendar for Thursday, less than 24 hours after the Fed.
GBP/USD DAILY CHART
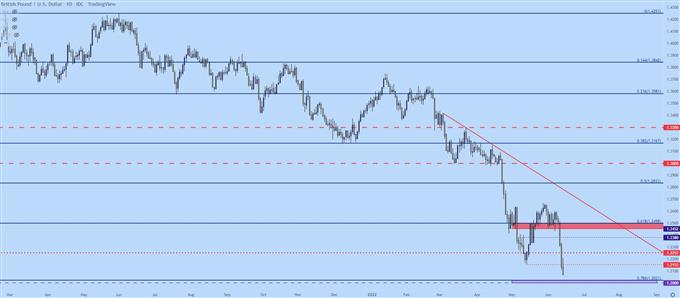
Chart prepared by James Stanley; GBPUSD on Tradingview
AUD/USD
The RBA hiked rates by 50 basis points early last week. But, one look at the weekly chart shows a market that’s clearly bearish on the matter as the past two weeks have produced a sharp reversal of the gains from the prior three weeks.
This exposes the current yearly low in the pair at .6830, and this also threatens to invalidate a bull flag formation that’s been setting up on the longer-term AUD/USD chart. A breach of the low opens the door for a run down to the 61.8% retracement of the 2020-2021 major move.
AUD/USD WEEKLY CHART
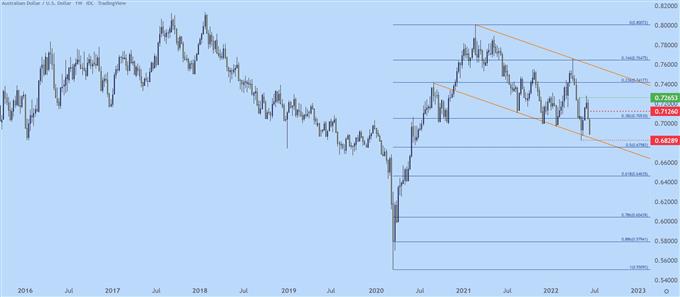
Chart prepared by James Stanley; AUDUSD on Tradingview
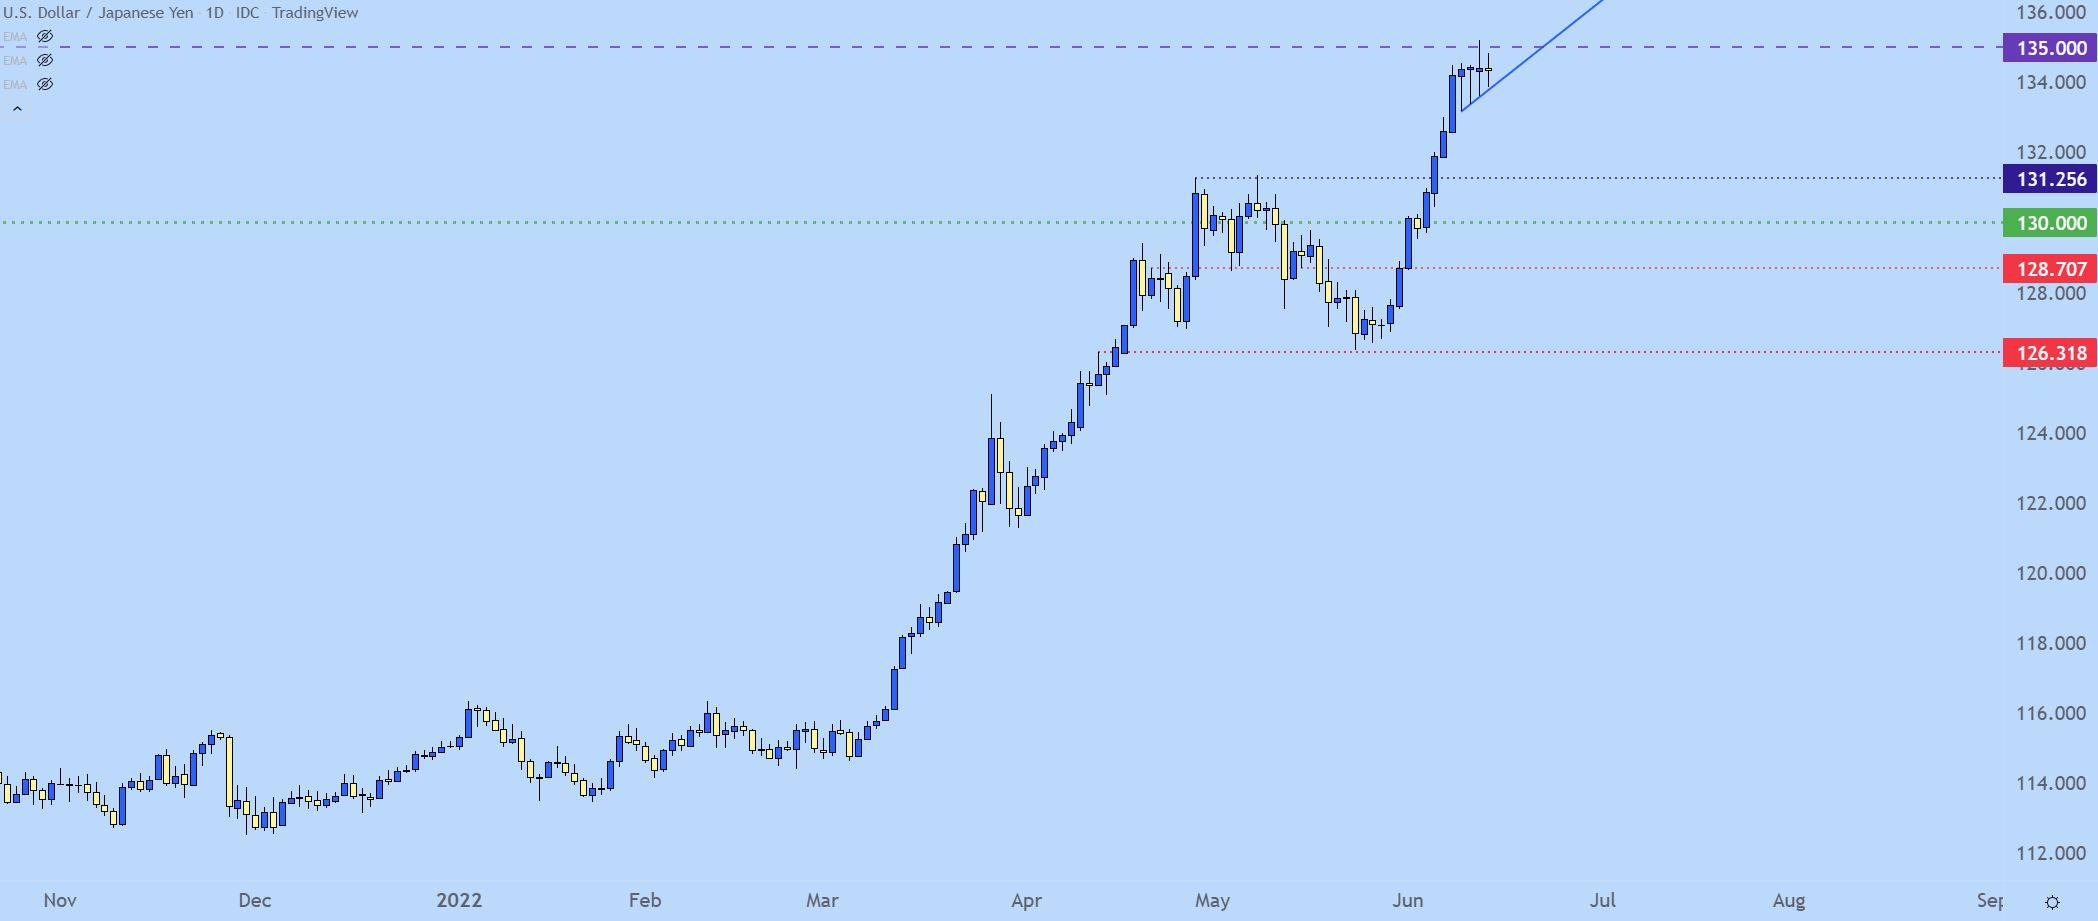
USD/JPY
The Bank of Japan meets on Thursday evening/Friday morning in Asia, and the big question is the BoJ’s tolerance towards all of the Yen-weakness that we’ve seen of recent.
As I had highlighted early last week, BoJ Governor Kuroda had seemingly opened the door to another run of Yen-weakness, saying that the bank wanted to see ‘stable’ inflation above 2%. At that point, there was but one inflation print that had come in over that marker and it was the most recent month at 2.5%, so markets were very much expecting the BoJ to remain loose and passive towards the matter.
Accordingly, Yen-weakness came back in a big way last week and USD/JPY shot-up to another 20 year high. Eventually, price trickled up to the 135.00 level which has stalled the advance for now. From the daily chart below, we can see the tension visibly displayed as the past three daily candles are highlighting varying forms of indecision.
USD/JPY DAILY PRICE CHART
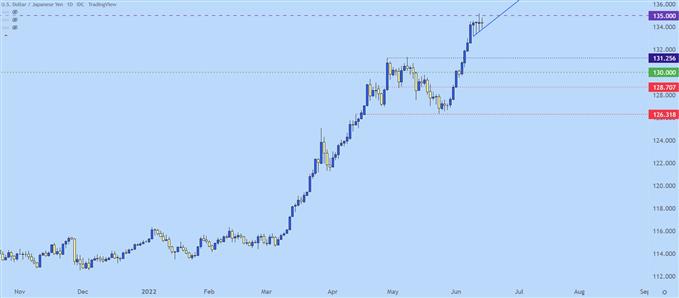
Chart prepared by James Stanley; USDJPY on Tradingview
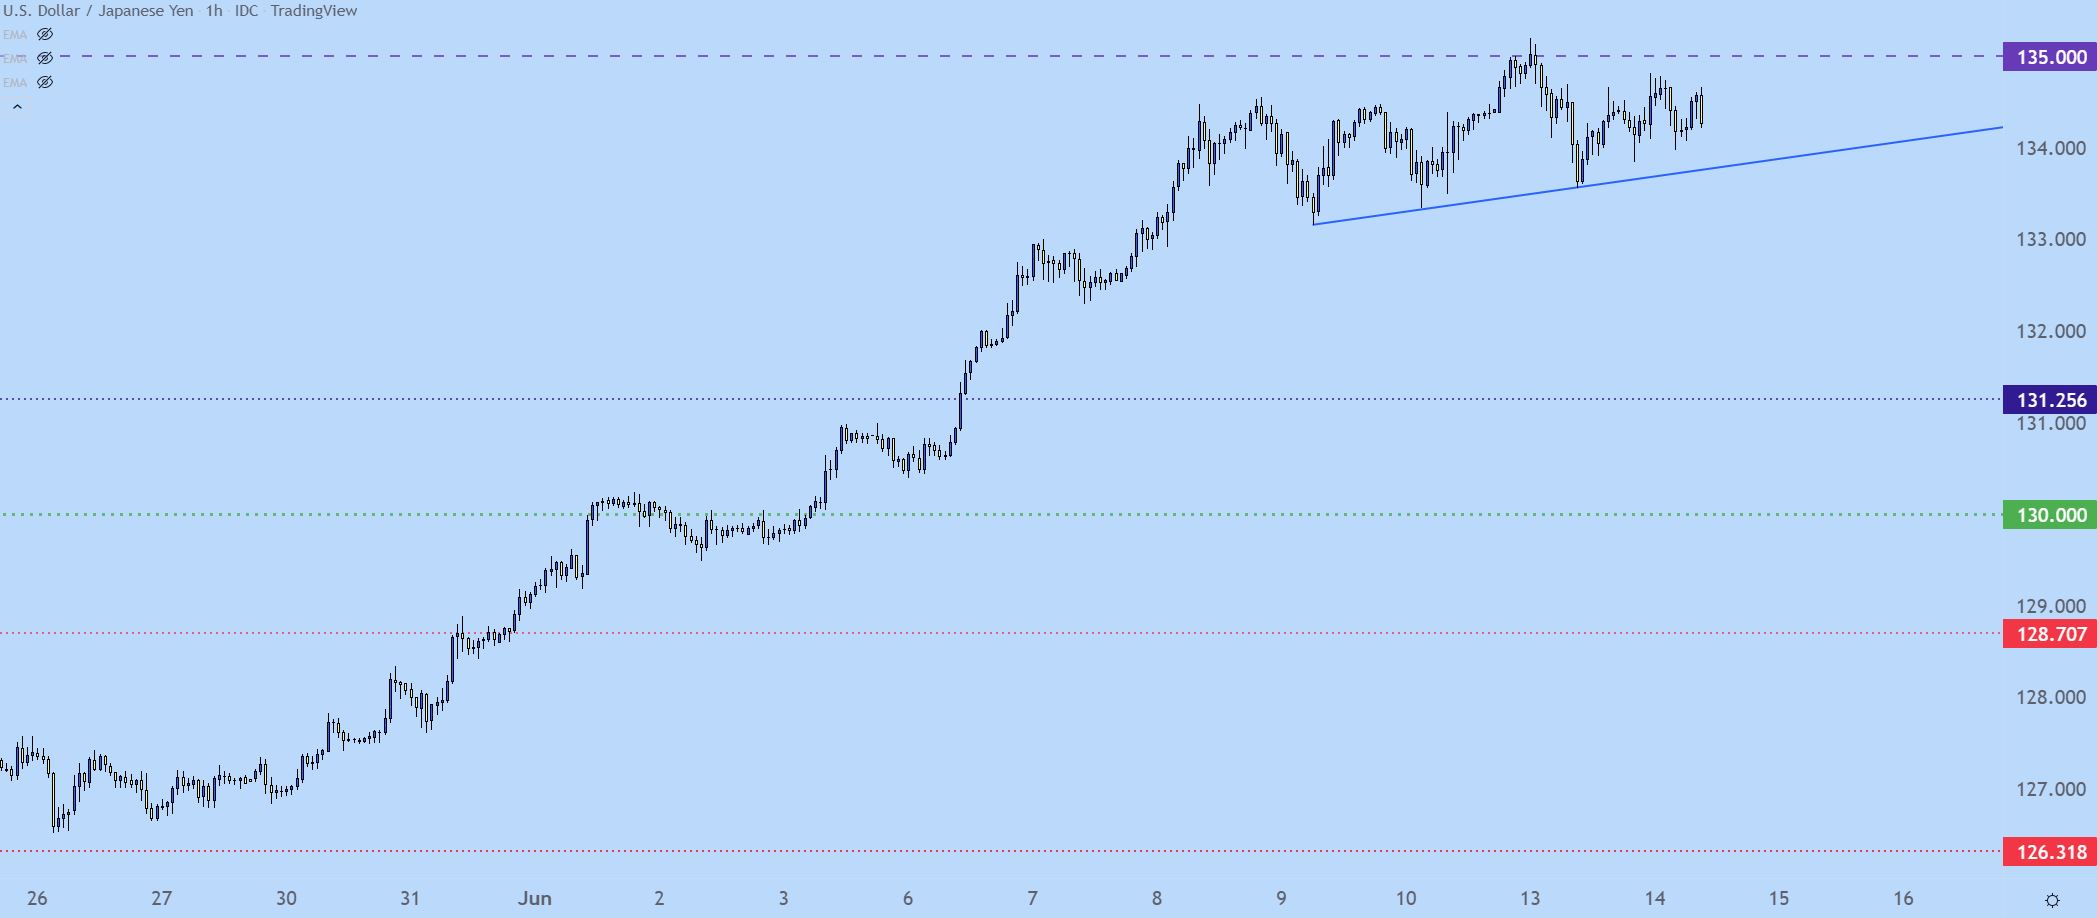
USD/JPY SHORTER-TERM
Going down to a tighter time frame and we can see the build of an ascending triangle formation with respect to that resistance at 135.00.
This keeps the door open for topside breakout potential as we near the FOMC rate decision which is then followed by the BoJ on Thursday of this week.
USD/JPY HOURLY PRICE CHART
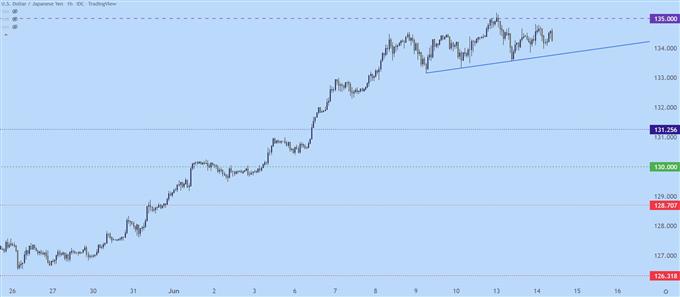
Chart prepared by James Stanley; USDJPY on Tradingview
--- Written by James Stanley, Senior Strategist for DailyFX.com. 14th June 2022
Any thoughts about it?

-
When it comes about Oil and contracts...
_20220614_16_30.thumb.png.b20d7f417483bb861e209e7484e6df30.png)
_20220614_16_33.thumb.png.f26dba430e0035a82a9e26214acb3da5.png)
_20220614_16_31.thumb.png.8f1ee5b48f41646b83312e72164a869b.png)


-
1
-
-
Is it market correction or the prelude of a bull market? For the past 4 years whenever it dropped that much at once, rebounded in a short time.
_20220614_16_10.thumb.png.5ac2556fddd0e04ed1650caa975a69d4.png)
-
1
-
-
On 06/06/2022 at 20:59, RomPathsSwap said:
Hi @MongilG
As a trader and investor, I personally prefer to be driven by volume and and other technical indicators rather than try to anticipate the market maker move which also sets the trend based on financial info instead of...political sentiments, I wish I would have been able to provide you an answer or expand the subject, unfortunately in my opinion there isn't anyone to be judged as individual, there'll always be others around with the capacity and even duty to correct and revise wrong decisions, on the other side Conspiration Theory has always been a success amongst people, good examples are the tales and stories, they might or might not be fictive, however the most successful are those that contain uncertainty, suspense and unexpected finals.
Ups...
-
1 hour ago, MongiIG said:
What confirmations would you be looking for on an uptrend on this pair?
All the best - MongiIG

-
1
-
-
3 hours ago, phillo said:

...it could be the 1st price, can fall even more...it is probably a good swing trading opportunity today!
-
1
-
-
3 hours ago, phillo said:
...and Up again...
-
1
-
1
-
-
Name of stock: iShares China Large Cap UCITS ETF
Name of Stock Exchange: LSE
Leverage or Share dealing: Leverage and Share dealing
Ticker: IDFX
Country of the stock: Exchange Traded Fund incorporated in Ireland
Market Cap: Fund Size 456.50M GBP as of 22/04/2022
-
1
-
-
10 minutes ago, Greenmantle said:
Well, the market went red and so to stay away seems the right thing to do. Fresnillo and National Express bucked the trend but their fundamentals do not suggest they are a buy. Precious metals may be a safer sector but I not really see any opportunities in the FTSE.
A good trader Buys and Sells as well, identifying the opportunities it should not be that difficult in a proper, undistracted and designed for environment.
") . Staying away is an outside or a beginner's emotion which I believe we are not here for, or to account their money .
. Staying away is an outside or a beginner's emotion which I believe we are not here for, or to account their money .
-
It's likely the ECB decision shall come when all restrictions around the world will be removed, the restrictions seem to generate the volatility rather than a delayed decision which under normal circumstances would have maintained the current levels.
The upcoming positive news and events will probably cover the present markets' sentiment for a couple of days, time enough to form new patterns, new resistance and new support levels on 4 hours and 1 day timeframes.
Unfortunately when it comes about Fx pairs, cannot be two winners at the same time 😀.
It's worthy being focused on European and British capital flows in two giant Red countries, it might become long term opportunities without prior notice.
-
1
-
-
It's interesting the whole process which I am absolutely sure, I can even 'feel it' is scalable, the size of the containers may vary, the country or place of manufacturing, the assembling point, and something that nobody mentioned yet: the economic importance at a national level, anything networked to a source of electricity has to be productive (except the source of electricity obviously, many governments support Electricity Companies that are not profitable and does not present any interest to potential buyers), has to pay the electricity bills,
Definitely 'may not be compared' with the old days, old containers, old immigrants, integration process and the economic importance, but as long as there is a certain number of bitcoins that cannot exceed, what impact is going to have over each individual economy in the world? Is it actually a technological race or quantitative competition?!
Sharing information can be vital, useful and advantageous because most content and every action has a developed plan, crypto mining is still under development or simply ends when the developers decide.


_20220618_23_55.png.46662baff8aa5f45c8c9b794a6eaede4.png)


_20220614_16_30.png.f960c10165114327ce7c93647fb1ef85.png)
_20220614_16_33.png.1716ae40fc2632f87a5a8929c76aab92.png)
_20220614_16_31.png.40b794cf781d302c9e3ed27482dc234e.png)


_20220614_16_10.png.f9e02ea985c3f7e22e4e4252a5912b65.png)


Different Platforms - Different Charts
in General Trading Strategy Discussion
Posted · Edited by Rude
Incomplete
P.S.: It could probably be very nice and profitable active participating in all analyses, debates and setups present on the site as long as 'it is treated as a full time job', leaving no other professional or employment choice, once again, unfortunately the presence in front of a monitor or display for long hours like 8 hours or longer turns to smash all previous education provided/ achieved and drives towards a different social life, generating a chain reaction that doesn't exclude healthcare sector and their education, aligning to different professional careers that may resume to titles only. Perhaps health and safety regulations that do not exclude those working in an office environment were implemented just to avoid all the mentions above, after that remaining a choice, a dependency, a necessity or no other alternative.