

phillo
-
Posts
1,258 -
Joined
-
Last visited
-
Days Won
69
Content Type
Profiles
Forums
Blogs
Events
Community Tutorials
Store
Posts posted by phillo
-
-
update

-
rejection so far

-
-
balanced move ?

-
-
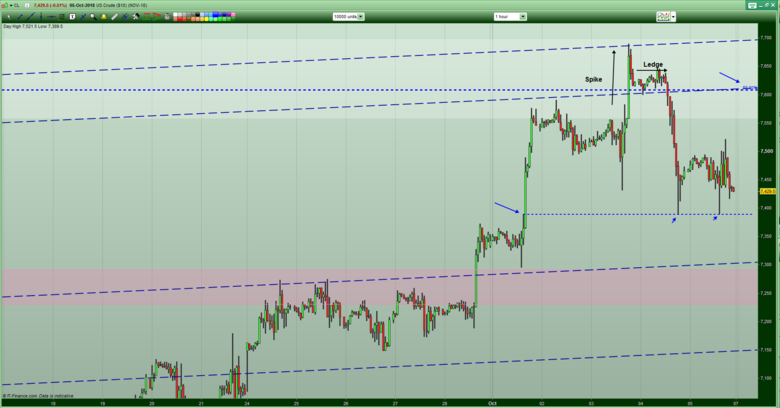
lovely test of that level. Lower timeframe chart shows a classis "spike & ledge" pattern, with the ledge holding above the "50%" level (nice squeeze)

-
If you guys "gut feelings or whatever are right about a move up in price, my opinion is a quick spike down ( stop run ) to suck up enough liquidity to then push it higher ( we'll see) Chart below suggests some levels

-
Charts below show that price is reaching a historically tested zone ( in my opinion! ) . However the lower timeframe charts show price still in a downward channel & the hourly timeframe shows price has fallen below the recent range with a 127.2% fib ext test possible , if not more. Either way, there is no sign yet of any reversal, but the levels, zones etc., are there to see


-
 1
1
-
-
still seems to have demand !


-
Well done
")
-
If I knew, I wouldn't have asked !!!!!
Obviously a channel break - recent director sell, had quite a run etc - but that's quite a move
-
-
thanks for the replies, you're very kind . I just thought that due to the size of the move, there was some news
-
After a good run , the price fell back quite a bit today & I don't know why. Can anyone shed some light on this price drop. Many thanks
-
Big level coming up, expecting price to thrust through it or reject it.

-
oops through s/b throw
-
Short term looks like it's been "flagging" with a potential H&S reversal forming. Longer term supply & demand zones shown. The Europeans are very good at creating situations that impact the Euro - Italy being the latest. Through in brexit and there is more uncertainty !


-
1
-
-
GBPUSD short term as I see things stand

-
Thank you
-
-
Love this stuff , keep it coming. Many thanks
-
1
-
-
good results today - running into resistance but has some momentum

-
yes, noticed the increase of minimum position size , which again, was a little disappointing
-
I did some live trades today


GBPUSD retrace trade
in Foreign Exchange (FX)
Posted