Top 3 Technical Analysis Charts for Trading

Entry posted by MongiIG in Analyst piece
1,703 views

- Reviewed by James Stanlely, Nov. 24, 2021
TECHNICAL ANALYSIS CHARTS: TALKING POINTS
Technical analysis of charts aims to identify patterns and market trends by utilising differing forms of technical chart types and other chart functions. Interpreting charts can be intimidating for novice traders, so understanding basic technical analysis is essential. This article reveals popular types of technical analysis charts used in forex trading, outlining the foundations and uses of these chart types.
HOW MANY TYPES OF CHARTS ARE THERE?
There are three main types of technical analysis charts: candlestick, bar, and line charts. They are all created using the same price data but display the data in different ways. As a result, they involve different types of technical analysis to help traders make informed decisions across forex, stocks, indices and commodities markets. While there are several different types of charts, this article is covering only the top three because these three are the most widely followed.
The three charts presented below have been selected as they are universal across most trading platforms.
TOP 3 TYPES OF TECHNICAL ANALYSIS CHARTS FOR TRADING
Line Charts
- Best for trading: Stocks
- Trading experience: Beginner
- Technical analysis technique: Holistic market overview which eliminates shifting data
- Advantages: Supports trading without the influence of emotions
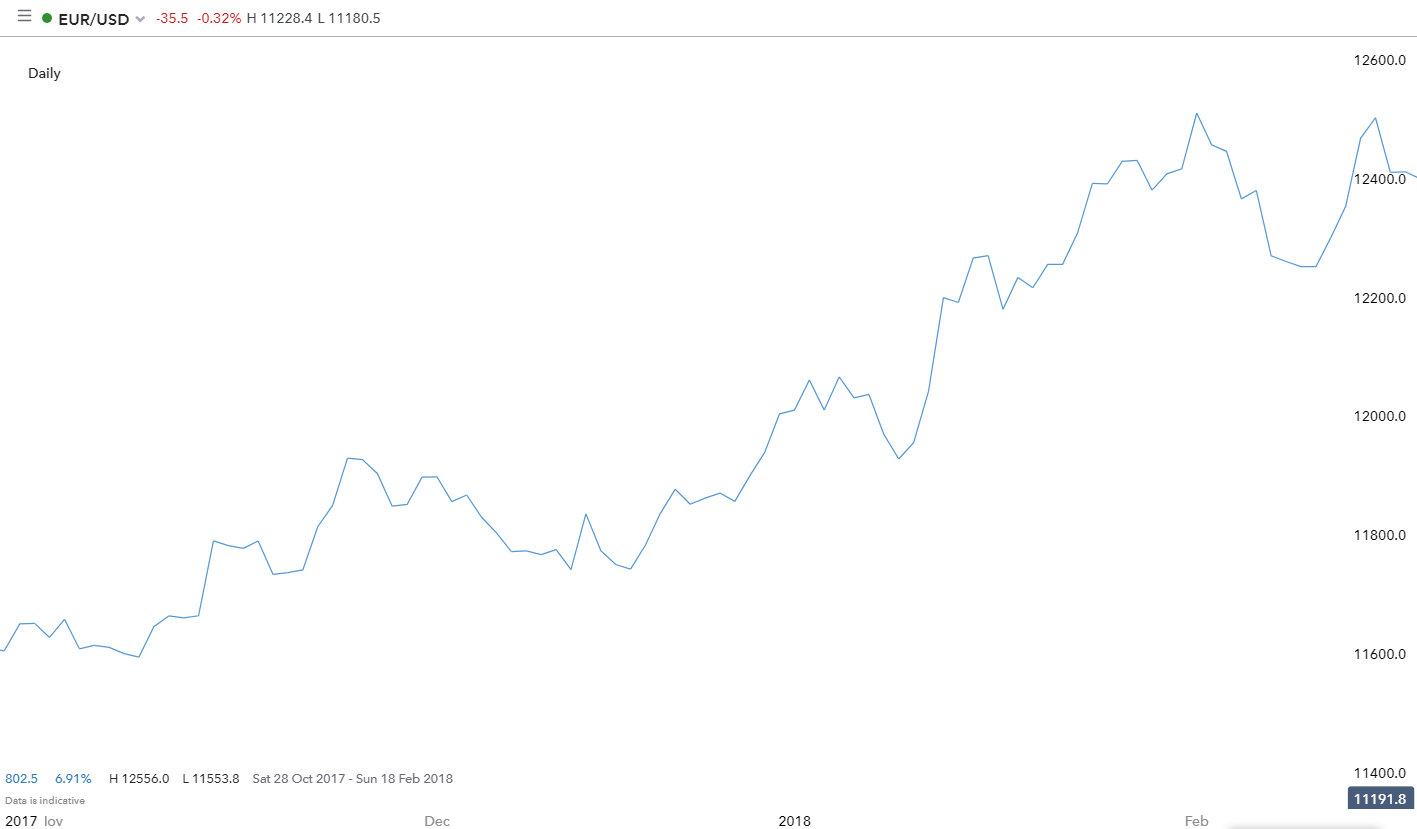
A line chart typically displays closing prices and nothing else. Each closing price is linked to the previous closing price to make a continuous line that is easy to follow.
This type of chart is often used for television, newspapers and many web articles because it is simple and easy to digest. It provides less information than candlestick or bar charts but it is better for viewing at a glance for a simplistic market view.
Another advantage of the line chart is that it can assist in managing the emotions of trading by selecting a neutral colour, like the blue chart depicted above. This is because the line chart eliminates ‘choppy’ movements in different colours as seen in the bar and candlestick charts.
Expert tip: Due to the line chart illustrating only closed prices, more experienced traders will consider a line chart to map out the daily closing prices or for situations when the analyst wants to inspect the sub-waves without the noise.
Bar (HLOC) Charts
- Best for trading: Forex, stocks, indices and commodities
- Trading experience: Intermediate
- Technical analysis technique: Use price data (HLOC) to identify trends, support/resistance and entry points
- Advantages: Provides the trader with more detail which helps to identify key levels and in-depth data
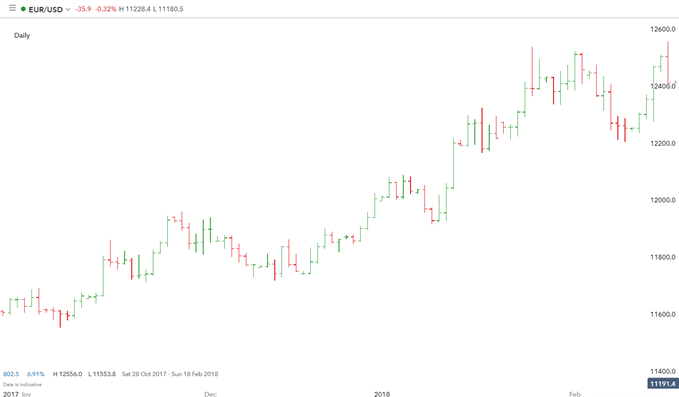
A bar chart displays the high, low, open and closing (HLOC) prices for each period designated for the bar. The vertical line is created by the high and low price for the bar. The dash to the left of the bar was the opening price and the dash to the right signals the closing price.
Being able to identify whether a bar closes up (green) or down (red), indicates to the trader the market sentiment (bullish/bearish) for that period.
The similarities between this chart type and a candlestick chart are visible when they are viewed side by side, but a bar chart is better for a cleaner market view. By removing the bolded colour from the chart, traders can view market trends with an uncomplicated outlook.
Candlestick Charts
- Best for trading: Forex, stocks, indices and commodities
- Trading experience: Intermediate
- Technical analysis technique: Equivalent to the bar chart technique (dependant on trader preference)
- Advantages: Candlesticks are easier on the eye for traders as opposed to bar charts, due to the fuller nature of the candlestick
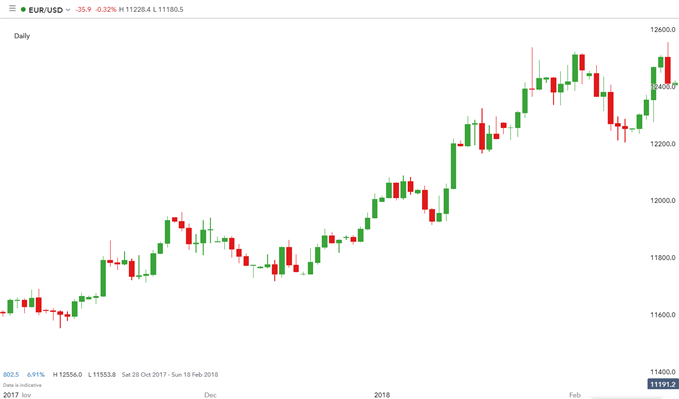
A candlestick chart displays the high, low, open and closing (HLOC) prices for each period designated for the candle. The “body” of each candlestick represents the opening and closing prices while the candle “wicks” display the high and low prices for each period.
The colour of each candle depends on the applied settings, but most charting packages will use green and red as the default colours. The green candles reflect that price closed higher than where it opened (often called a bullish candle), and every candle that is red means the price closed lower than where it opened (often called a bearish candle).
The candlestick chart is by far the most popular type of chart used in forex technical analysis as it provides the trader with more information while remaining easy to view at a glance.
Discover the top 10 candlestick patterns to trade with
HOW TO ANALYSE TECHNICAL CHARTS
Charting techniques in technical analysis will vary depending on the strategy and market being traded. It is important to be familiar and comfortable with a strategy to then implement that strategy accurately. Analysing charts based on the strategy will allow for consistency in trading.
Questions to ask before selecting a technical analysis chart type:
- What is the trading strategy being adopted?
- Is the trading strategy targeting short, medium or long-term trades?
Once the above questions can be answered, the chart type may then be selected using the respective information provided.
Explore the foundations of multiple time frame analysis.
LEARN MORE ON TECHNICAL ANALYSIS
- Technical traders have different styles and strategies. Explore these thoroughly to find out if this type of analysis suits your personality.
- We have a comprehensive introduction to technical analysis which will help you form a solid technical foundation.
- Supplement your understanding of technical analysis charts with our forex candlesticks article.
- Learn more about less popular type of charts like Heikin Ashi, Renko, and Point & Figure charts.
Dec 23, 2021 | Warren Venketas, Analyst. DailyFX


0 Comments
Recommended Comments
There are no comments to display.
Create an account or sign in to comment
You need to be a member in order to leave a comment
Create an account
Sign up for a new account in our community. It's easy!
Register a new accountSign in
Already have an account? Sign in here.
Sign In Now