Tesla’s share price: what to expect from Q4 results
Find out what to expect from Tesla’s earnings results, how they will affect Tesla share price, and how to trade Tesla’s earnings.
 Source: Bloomberg
When is Tesla’s results date?
Tesla's fourth-quarter (Q4) earnings are expected to be released this Wednesday, 26 January after the market close.
Tesla share price: forecasts from Q4 results
Deliveries' figures released at the start of the month blew past analysts’ expectations with 308,600 electric vehicles for Q4 of last year, and for the year far exceeded numbers produced for 2020. A total of 936,172 vehicles for 2021, the premium Model S sedan and Model X SUV still taking a minority stake of the total at less than three percent, and less than four percent of Q4.
The numbers out of China have also been promising, the China Passenger Car Association (CPCA) showing a record 70,000+ China-made vehicles during December, nearly three times higher when compared to the same month last year, month-on-month growth of 34%, and surpassing average capacity estimates for its Shanghai plant showing both brand and operational strength at a time when car companies globally have been struggling on the supply chain front.
It seems everyone’s starting an electric car venture, but it’s got to worry more about the established companies be they car giants like VW, GM, and Ford, or tech like Apple, some of whom are going all-in with big investments and their own electric vehicle line-ups getting introduced.
But that’s to be dealt with later, as the focus is going to be on its earnings and an update on its product roadmap. In all, revenue at over $16 billion and earnings per share estimate of $2.23 that in turn has been rising as it incorporates the latest figures and what have been upside surprises are what analysts are expecting (source: finance.yahoo.com), though net they hold a more slight buy bias than they did over the last two months of 2021, and an average price target below current prices (though the range in terms of price targets is usually highest here).
Trading Tesla’s Q4 results: weekly technical overview and trading strategies
Its share price was in for retreat off of the highs last quarter when news first broke that Tesla chief executive officer (CEO) Elon Musk would be selling a portion of his shares, since then large moves failed to translate into a trend move, opting instead to average back. From a technical standpoint in the weekly time frame, prices have remained above their main short and long-term moving averages, with an average directional movement index (ADX) reading slightly above trending territory, and its directional movement index (DMI) relatively positive with a decent enough margin of its DI+ line over its DI-.
Bullish moves with a brief glance at the weekly chart that incorporates more historic data, but zooming into the daily and it’s been a struggle where most of its key technical indicators are neutral, and a more ‘consolidation – volatile’ overview where we’ve been getting moves past key shorter-term levels, but it’s consolidated back towards a mean. Under such an overview it’s usually conformist strategies that are breakout off of 1st levels while contrarian strategies are reversals.
But if we are to take a look at it from a longer-term weekly time frame standpoint in the table below, it’s a heavily stalling bull trend that’s failed to give conformist buy-breakout strategies an opportunity on most weeks over the past two months, giving contrarian sell strategies a chance to outperform. Volatility is expected to spike with the release meaning it won’t be so much a buy versus sell than breakout versus reversals, those planning to go opposite any volatile move ideally doing, so after the level is breached and waiting for a reversal to pan out to avoid getting stopped out on the first move (and hence not initiating at/before as seen in technical contrarian strategy below but situating for a fundamental move and working via reversal).
Fundamentally factoring in the latest moves for the tech sector on the spike in yields causing investors to reassess valuations, and it could also add to the narrative of a more volatile overview where conformist strategies are breakout, while reversals and fading for contrarian strategists who presume the current levels can hold.
| Current Technical Overview | Bull Trend - Stalling |
| Technical Overview Conformist Strategies | Buy 1st Support After Reversal, Buy 1st Resistance Upon Breakout From Below |
| Technical Overview Contrarian Strategies | Sell 1st Resistance At/Before Price, Sell 1st Support Upon Breakout From Above |
| S/L for 2nd Resistance | 1114.34 |
| 2nd Resistance | 1092.67 |
| S/L for 1st Resistance | 1071.01 |
| 1st Resistance | 1049.34 |
| Relative Starting Point | 1006.00 |
| 1st Support | 962.66 |
| S/L for 1st Support | 940.99 |
| 2nd Support | 919.33 |
| S/L for 2nd Support | 897.66 |
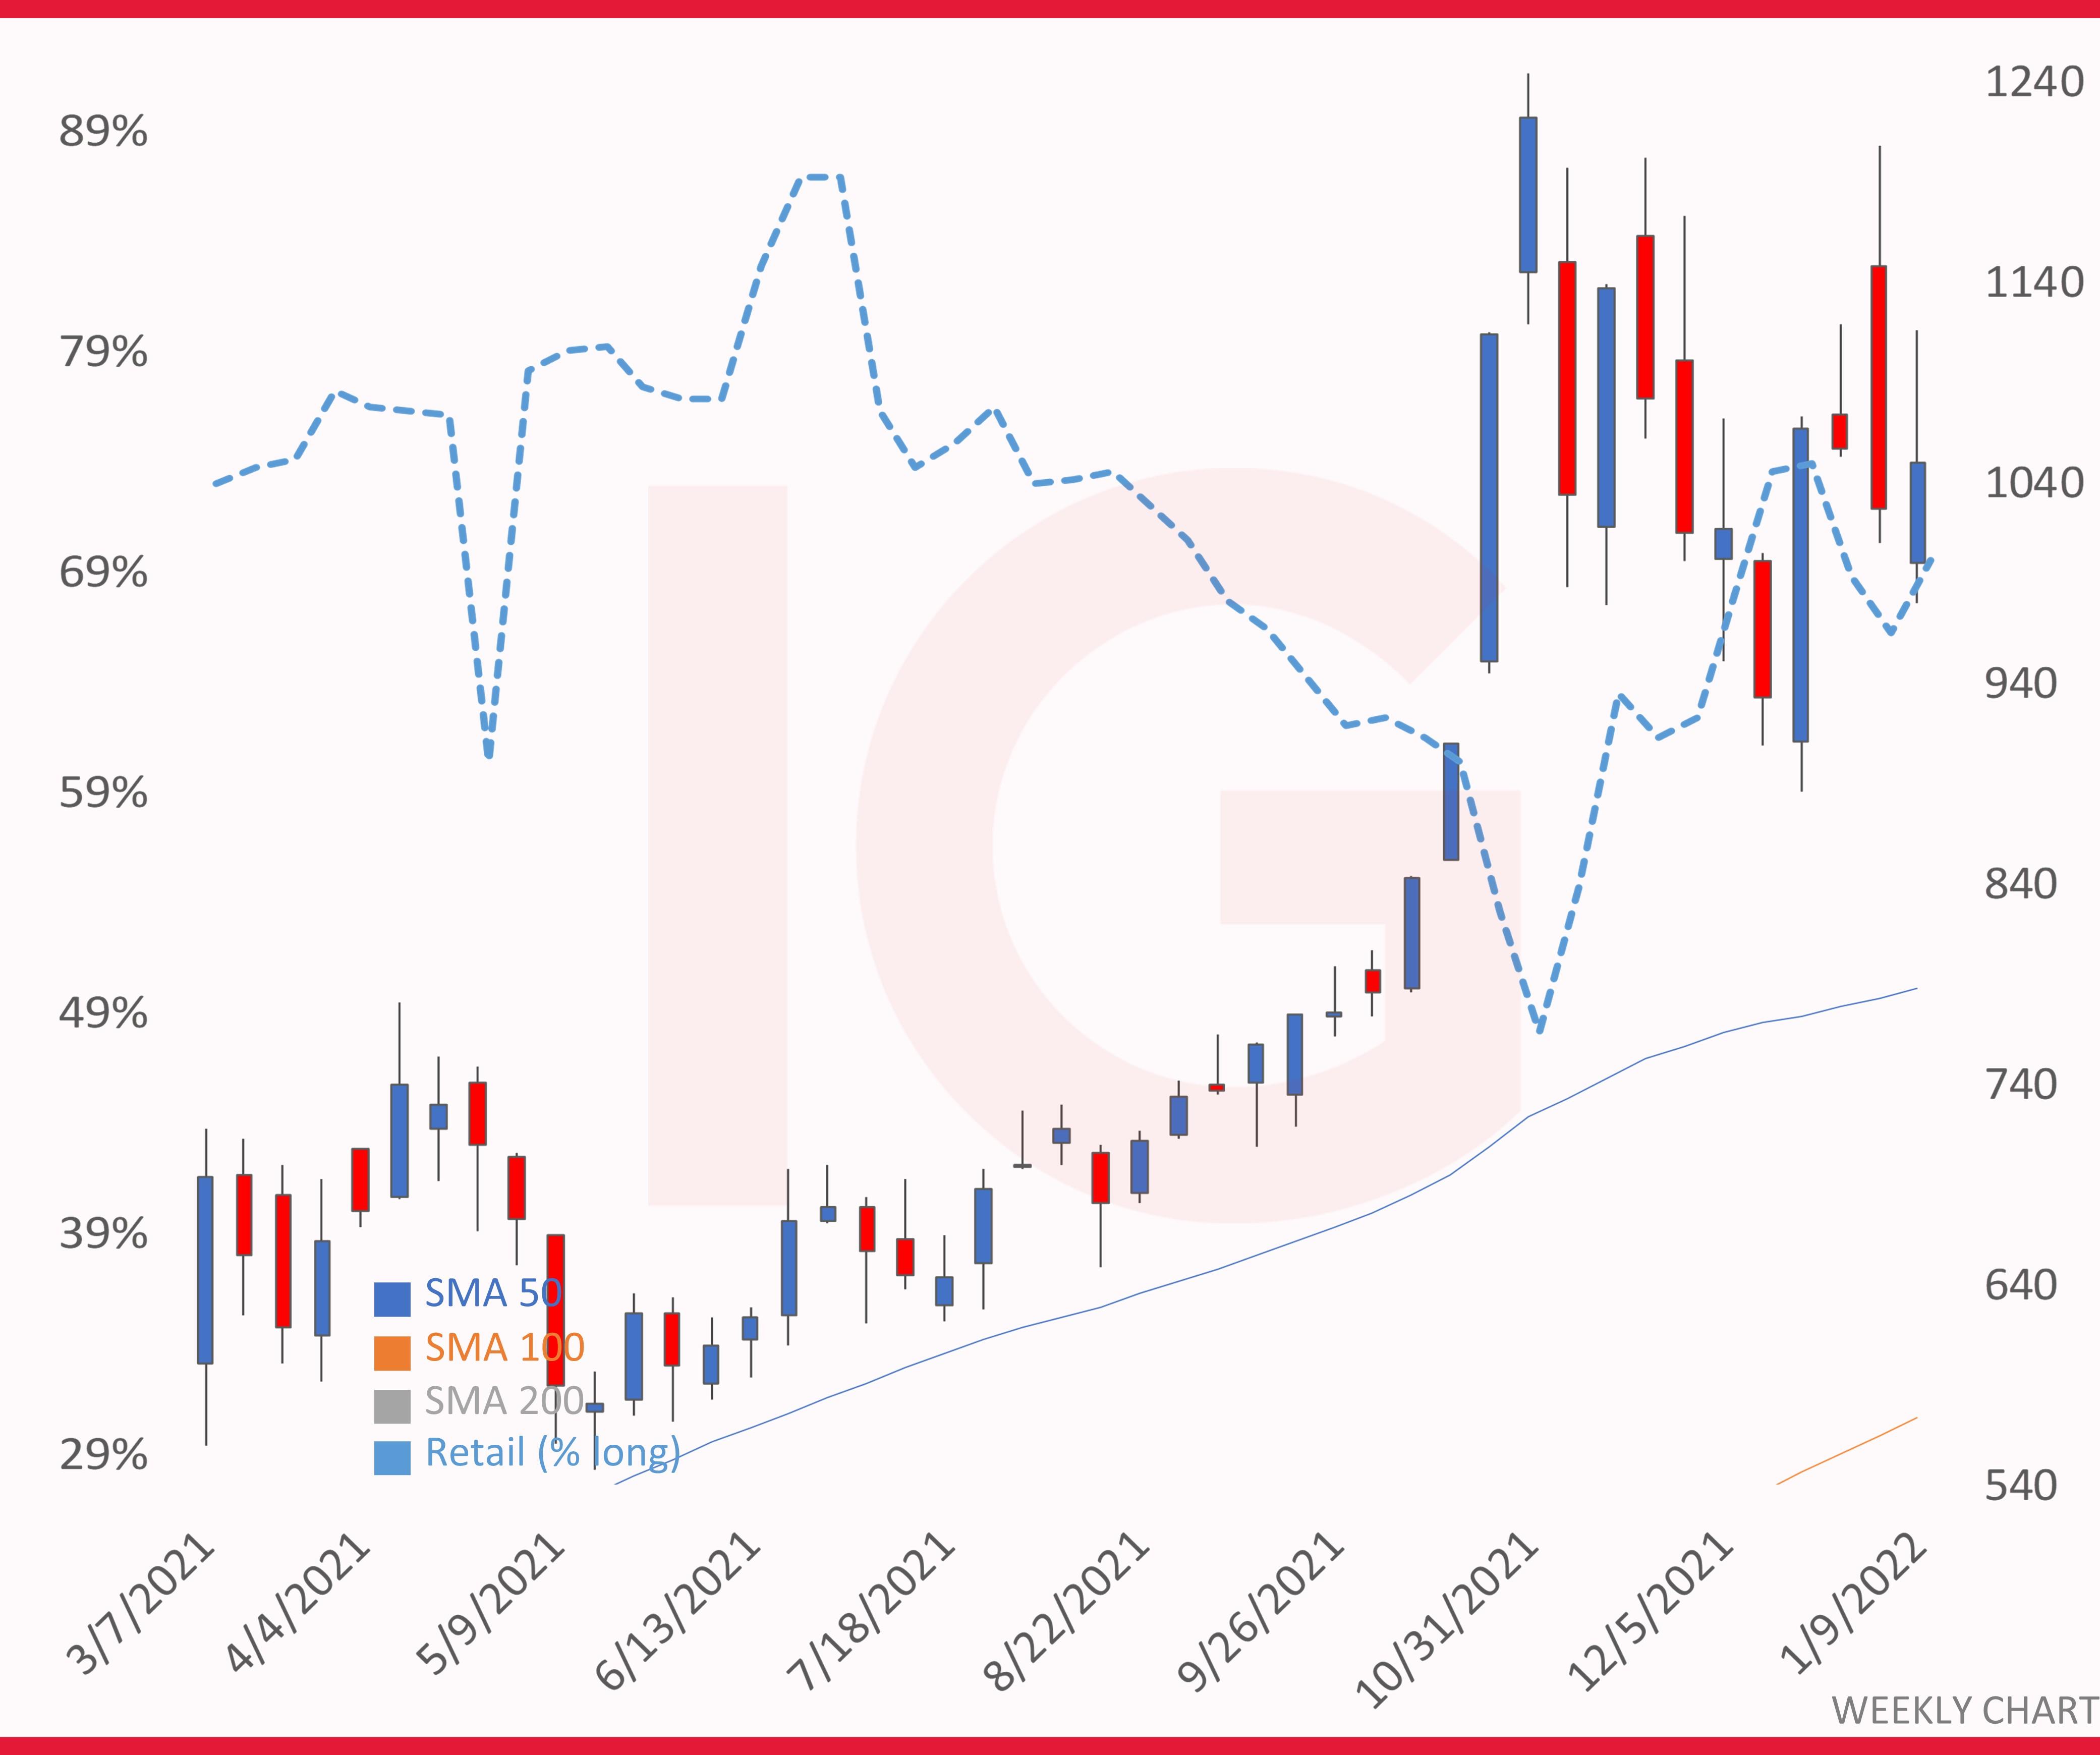
Tesla weekly chart with IG client sentiment
 Source: IG charts
IG client sentiment* and short interest for Tesla shares
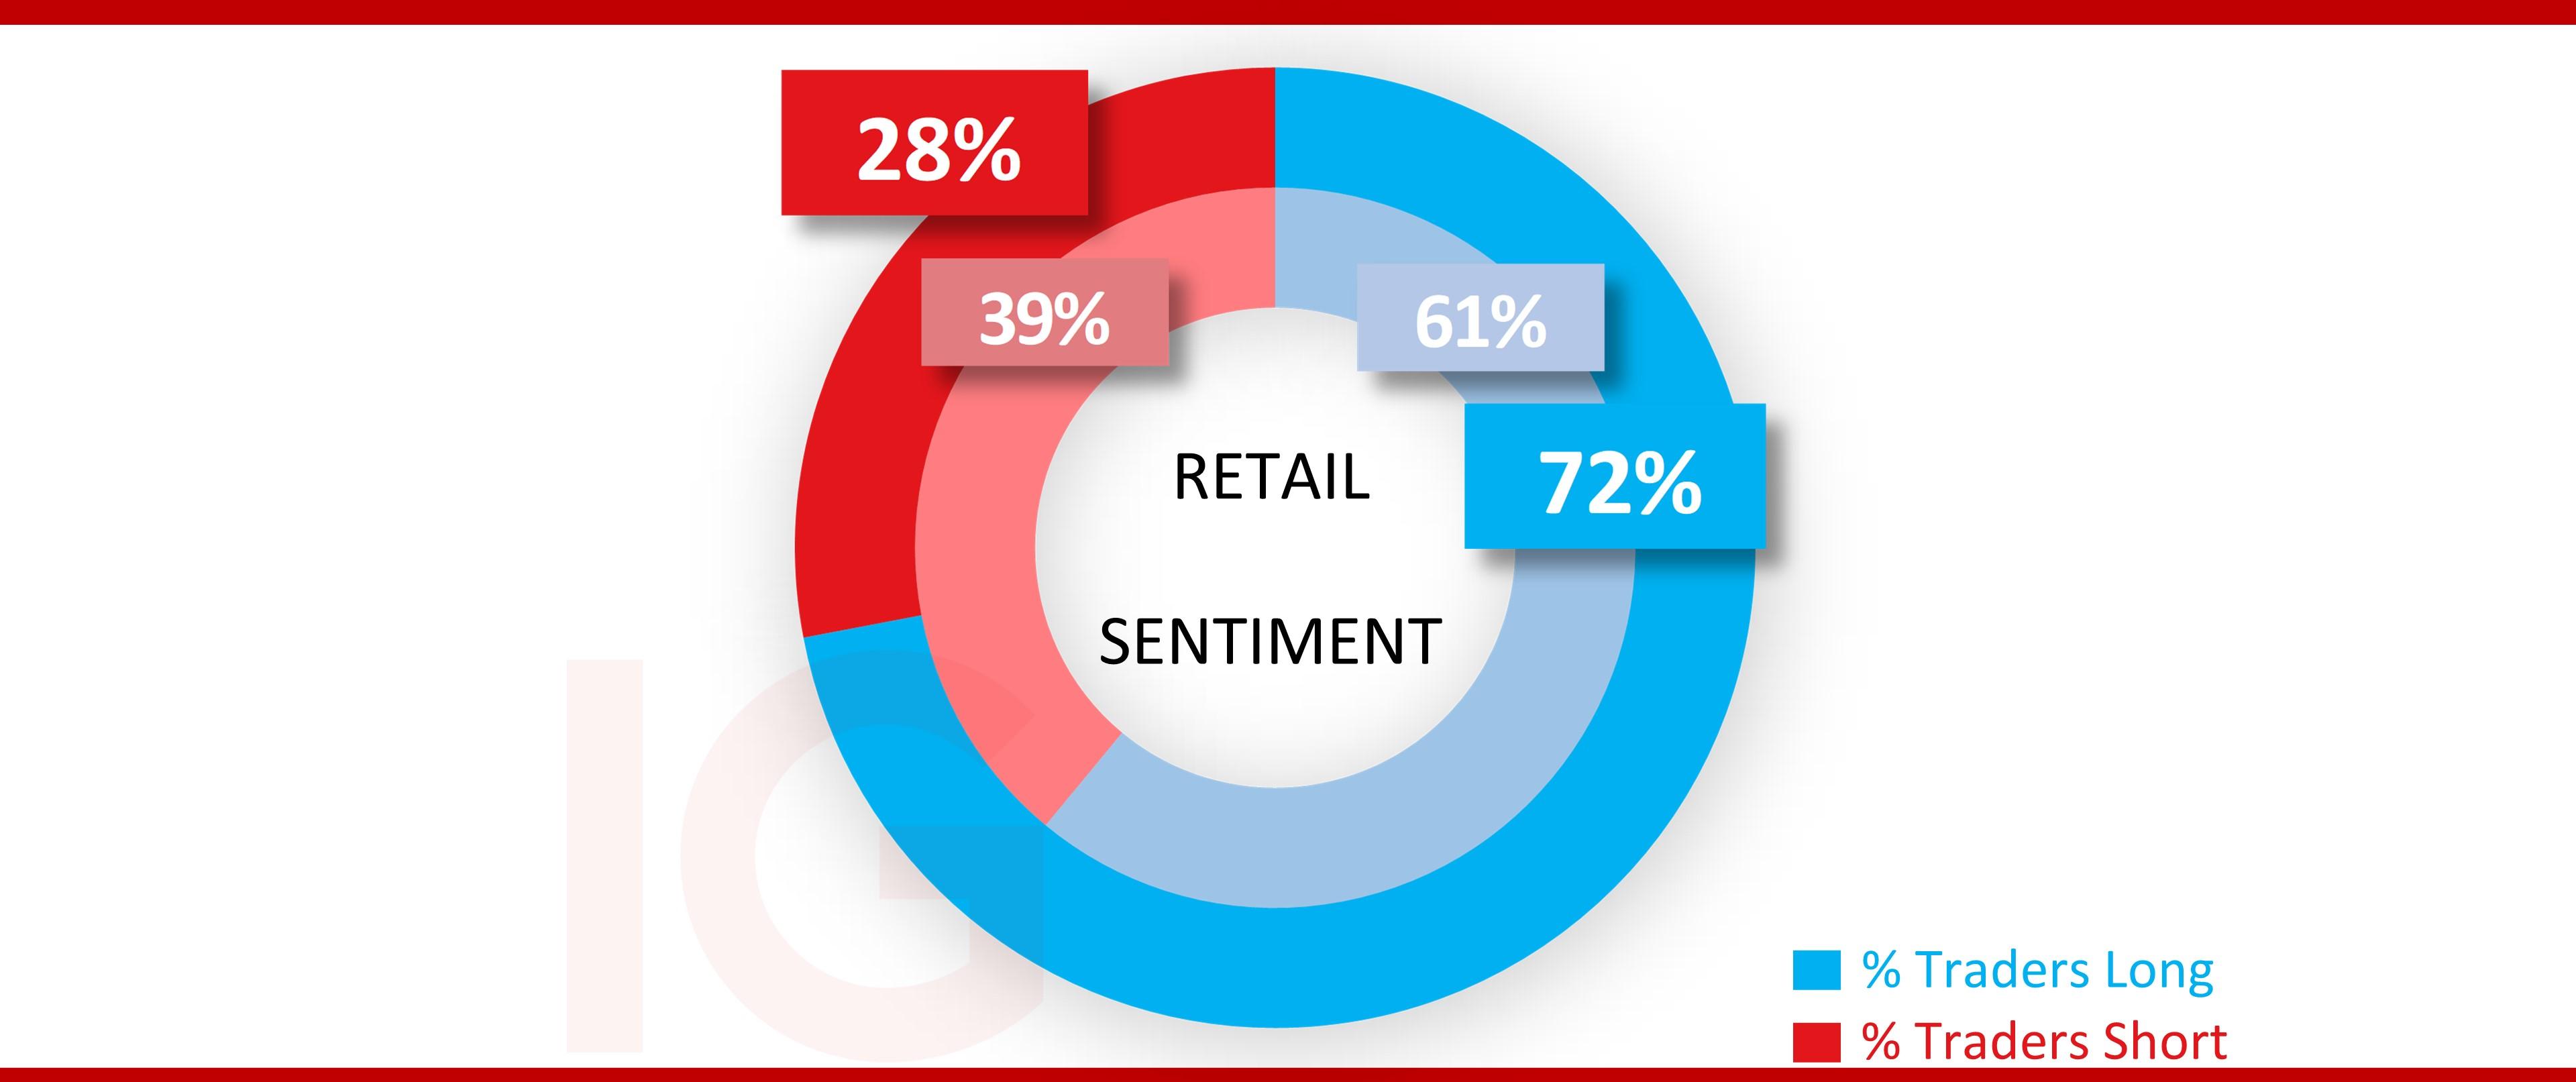
Retail trader bias (blue-dotted line in the above chart) is usually a consistent buy, but over Q4 the price spike briefly above $1240 saw sentiment amongst them shift to majority short for the first time in nearly a year and timing it to near perfection. But as has been the case consistently, they shifted back to majority buy on the retracement off the highs, and now heavy long at 72% at the start of this week, far higher than the 61% buy bias from the previous Q3 earnings preview.
 Source: IG
As for short interest, it’s fallen since the start of the fourth quarter when it was 3.64% on 29.2 million shares mid-October of 2021, the latest at 22.47 million shares representing a smaller 2.78% of the total (source: shortsqueeze.com).
*The percentage of IG client accounts with positions in this market that are currently long or short. Calculated to the nearest 1%, as of the start of the week for the outer circle. Inner circle is from the previous Q3 earnings preview posted on Monday, October 18, 2021.


.jpeg.98f0cfe51803b4af23bc6b06b29ba6ff.jpeg)
0 Comments
Recommended Comments
There are no comments to display.
Create an account or sign in to comment
You need to be a member in order to leave a comment
Create an account
Sign up for a new account in our community. It's easy!
Register a new accountSign in
Already have an account? Sign in here.
Sign In Now