AU March jobs preview and what's next for AUD/USD

Entry posted by AshishIG in Market News
1,152 views
Following the release of US jobs data on Friday night, the next important set of jobs data is the Australian Labour Force report for March, released Thursday morning at 11.30 am AEST.

Source: Bloomberg
Tony Sycamore | Market Analyst, Australia | Publication date: Wednesday 12 April 2023 10:22
The release of US Employment data on Friday night confirmed that the pace of employment growth in the US was in line with expectations.
The slowest pace of job growth since December 2020 was topped off by average hourly earnings which increased by 4.2% YoY in March, its smallest increase since June 2021, supporting the idea that the Fed is very close to ending its tightening cycle.
The next important set of jobs data for traders is the Australian Labour Force report for March, released Thursday morning at 11.30 am AEST.
What is expected?
After declines in December (-16.6k) and January (-10.9k), employment bounced back in February, increasing by +64.6k.
With holiday period seasonal volatility now in the rear vision mirror, the market is looking for a +20k rise in jobs and for the unemployment rate to rise to 3.6% in March from 3.5% in February.
What would constitute a surprise?
The market will look for evidence of moderation in the labor market (as viewed in the US last Friday night) to support market pricing that the RBA’s rate hiking cycle will remain on hold.
To this effect, should the unemployment rate print at 3.7% or higher, it would be a good guide that the RBA will stay on the sidelines in May (pending Q1 inflation data) and spark further conversation around RBA rate cuts in the second half of this year. However, this would be a small negative for the AUD/USD.
Conversely, should the unemployment rate print at 3.5% or lower, and if Q1 2023 CPI data (released on April 26th) is hotter than expected, it would likely force the RBA to lift the cash rate again by 25bp to 3.85% as early as its May meeting.
In turn, this would be a small net positive for the AUD/USD.
Australian employment rate chart

Source: Trading Economics
AUD/USD technical analysis
Last week the AUD/USD closed 0.24% lower at .6669, weighed on by the RBA’s pause and mounting expectations of a 25bp rate hike from the Fed at its May meeting, not to mention global growth slow-down concerns.
Besides the brief pre-RBA short squeeze earlier this month, the AUD/USD has spent the past six weeks trading below the 200-day moving average without really building on the downside momentum it gained in early March.
Nonetheless, unless the pair were to see a break above the 200-day moving average at .6746 and above the early April .6794 high, we will remain with the negative bias looking for a move towards .6500c.
AUD/USD daily chart
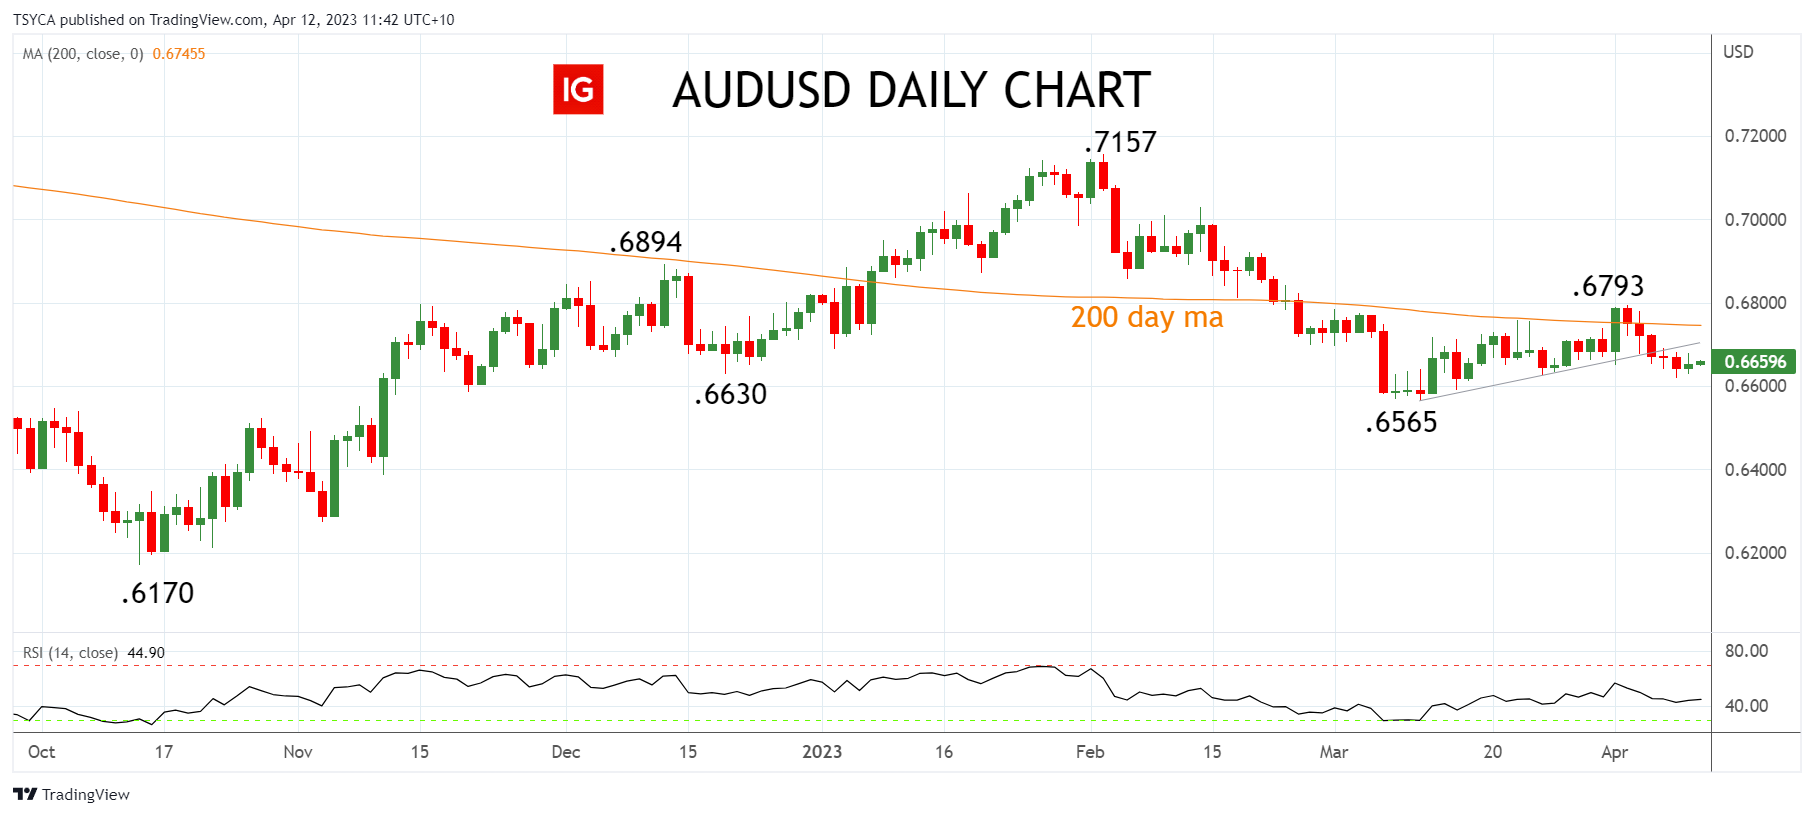
Source: TradingView
- TradingView: the figures stated are as of April 12th, 2023. Past performance is not a reliable indicator of future performance. This report does not contain and is not to be taken as containing any financial product advice or financial product recommendation
-
 1
1


0 Comments
Recommended Comments
There are no comments to display.
Create an account or sign in to comment
You need to be a member in order to leave a comment
Create an account
Sign up for a new account in our community. It's easy!
Register a new accountSign in
Already have an account? Sign in here.
Sign In Now