Brent crude oil drops by over 5%, gold range trades and copper tries to find support amid recession fears.

Entry posted by OfentseIG in Analyst piece
6,192 views
Outlook on Brent crude oil, gold and copper amid resurfacing recession fears
Axel Rudolph FSTA | Senior Financial Analyst, London
Brent crude oil drops by over 5% in two days
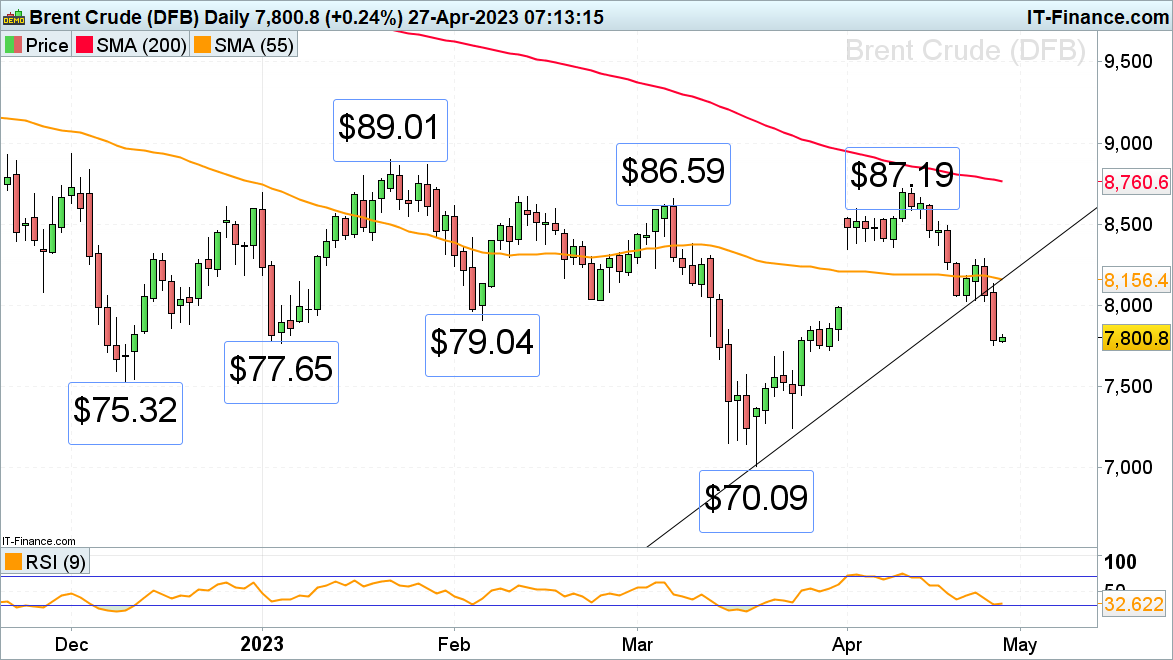
Oil - Brent Crude oil’s descent accelerated as global recession fears and renewed concerns about the banking sector weighed on risky assets.
Brent crude oil not only slid by over 5% in the past couple of days but also closed its March-to-April price gap while testing its January low at $77.65 despite falling US inventories. According to Tradingeconomics “the latest EIA report showed US crude inventories dropped 5.054 million barrels last week, far exceeding expectations of a 1.486 million barrel decline.”
The December trough at $75.32 represents the next downside target, below which there isn’t much support to speak of ahead of the $70.09 March low.
While the psychological $80 region caps, further downside is expected to be witnessed.
 Source: ProRealTime
Gold continues to flirt with the psychological $2,000 mark
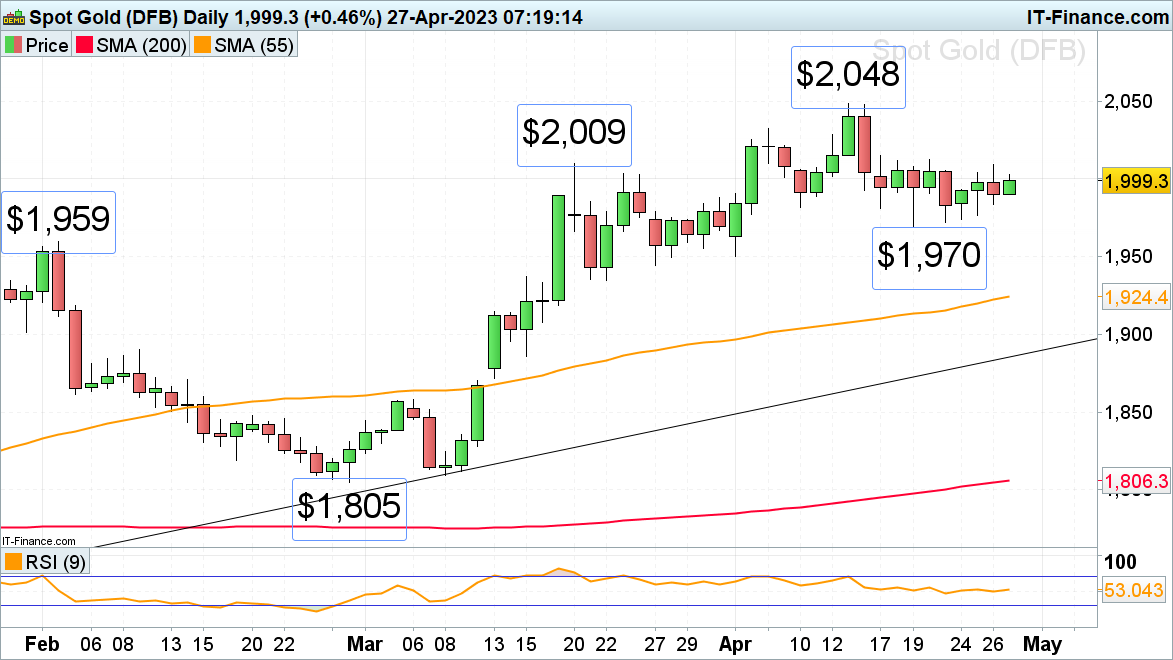
Spot Gold continues to sideways trade below its one-year $2,048 per troy ounce mid-April high and does so around the psychological $2,000 mark while being stuck in a range between $2,012 and $1,970 since last week, the break out of which is likely to determine the ensuing trend.
A rise and daily chart close above the $2,012 level would engage the 5 April high at $2,032 and probably also the $2,048 peak and above whereas a fall and daily chart close below the $1,970 level should lead to the February high at $1,959 ahead of the $1,950 to $1,935 support zone, the late March and early April lows, being revisited.
Immediate resistance remains to be found between the $2,003 to $2,009 late March and Wednesday’s high.
 Source: ProRealTime
Copper tries to find support around its March low
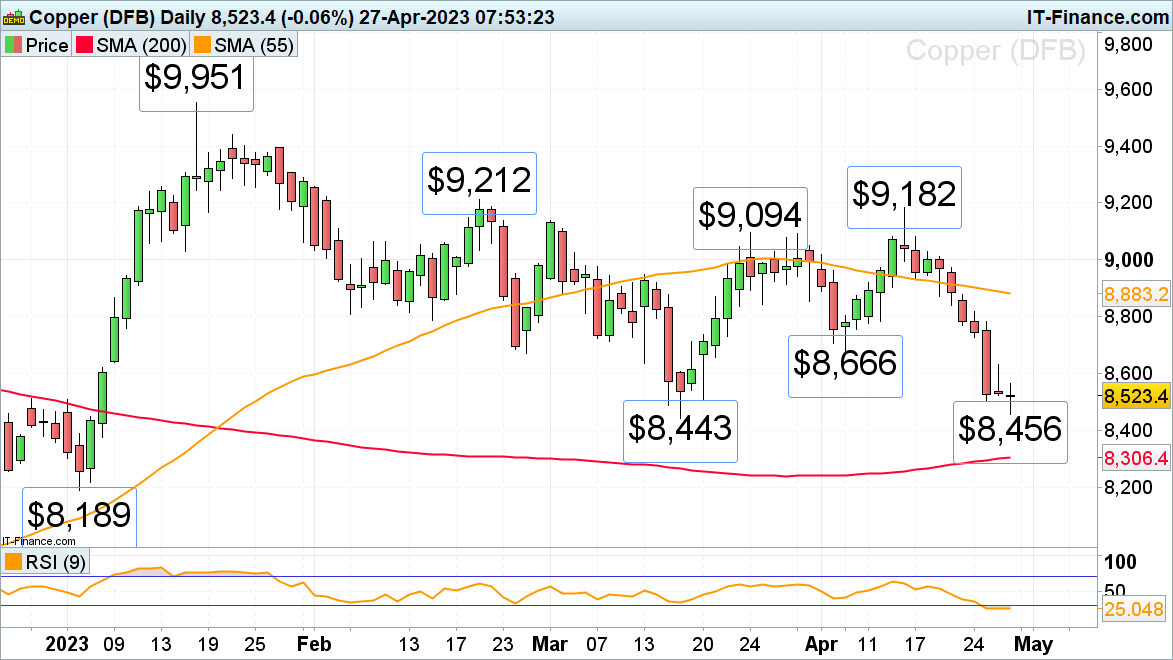
The price of Copper has dropped by over 6% on recession fears but is trying to stabilise around its $8,443 per ton low after six consecutive days of losses.
Should it not succeed in doing so, the 200-day simple moving average (SMA) at $8,306 may be reached next. Further down sits the January trough at $8,189.
Were a bounce to be seen, the early April low at $8,666 is likely to act as initial resistance.


0 Comments
Recommended Comments
There are no comments to display.
Create an account or sign in to comment
You need to be a member in order to leave a comment
Create an account
Sign up for a new account in our community. It's easy!
Register a new accountSign in
Already have an account? Sign in here.
Sign In Now