Ahead of the game: August 7, 2023

Entry posted by AshishIG in Analyst article
987 views
Your weekly financial calendar for market insights and key economic indicators.

Source: Bloomberg
Reverberations rippled across markets as Fitch, the rating agency, downgraded the United States' long-term credit ratings from AAA to AA+. However, this downgrade shouldn't have caught everyone off guard, as Fitch had already issued a warning about the potential downgrade during the US debt ceiling negotiations in May.
In practical terms, the downgrade has had little impact on holders of US Treasuries, as suitable alternatives are scarce. However, amidst higher yields, weak China PMI and ISM data, and elevated equity markets, it acted as a catalyst, triggering a rush to exit positions.
On the local front, the Reserve Bank of Australia (RBA) maintained its cash rate at 4.10% for the second consecutive month. The RBA's decision to keep rates steady aligns with last month's reasoning, aiming to assess the impact of the cumulative 400bp rate hikes and gauge evidence of a sustainable rebalancing between supply and demand.

- Bank of England raised rates by 25p to 5.25%
- Fitch downgraded US long-term credit ratings to AA+ from AAA
- Caterpillar and Amazon share prices surged on strong earnings
- US ISM manufacturing survey at 46.4 in July, 9th consecutive month in contraction
- RBA kept cash rate on hold at 4.10% for two consecutive months
- Crude oil near $82.00 p/b after Russia and Saudi Arabia extend production cuts
- AMD, PayPal, and Qualcomm stocks dropped post disappointing earnings
- Gold down to $1930 as US yields rise
- Bitcoin briefly below $29,000
-
Dow Jones fear gauge VIX up ~20% to 15.93.


- AU: Westpac Consumer Confidence (Tuesday, August 8, 10:30 am AEST)
- AU: NAB Business Confidence (Tuesday, August 8, 11:30 am AEST)
- NZ: Business NZ PMI (Friday, August 11, 8:30 am AEST)

- CN: Balance of Trade (Tuesday, August 8, 1 pm AEST)
- CN: Inflation (Wednesday, August 9, 11:30 am AEST)
- CN: New Yuan Loans (Friday, August 11, TBC)

- US: Inflation (Thursday, August 10, 10:30 pm AEST)
- US: PPI (Friday, August 11, 10:30 pm AEST)

- UK: GDP (Friday, August 11, 4 pm AEST)

Source: Bloomberg
-
CN
China CPI
Wednesday, August 9 at 11.30 am AEST
China's consumer prices saw an unexpected decline, registering 0% YoY in June 2023, missing the expected rise of 0.2%. This marked the lowest reading since February 2021, mainly attributed to decreases in non-food prices, transport, and education. The monthly CPI also fell by -0.2%, marking the fifth consecutive month of declines, below the consensus forecast for a flat reading.
For this month, the market anticipates a further decline in CPI to -0.5% YoY as the Chinese reopening faces obstacles, consumer caution persists, and the economy approaches deflation for the first time since February 2021.
Such soft numbers may lead to calls for additional stimulus to avoid a Japanese-type deflationary spiral. PBOC Governor Yi Gang previously downplayed deflation risks and emphasized the presence of "ample policy room" to support economic growth.
China CPI chart
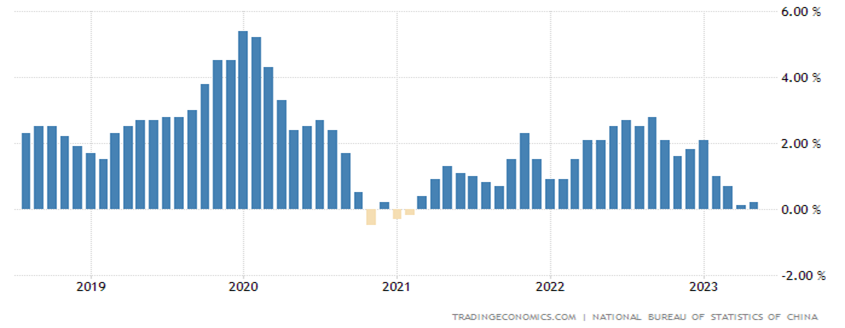
Source: TradingEconomics
-
US
CPI
Thursday, August 10 at 10.30 pm AEST
Last month, headline CPI in the US slowed to 3%, the lowest in two years, compared to 4.0% in May. The fall was driven by a decline in energy prices. Core CPI, which excludes volatile items like food and energy, eased to 4.8%, the lowest since October 2021, down from 5.3% in May, but still above the Fed's target.
For this month, both US headline and core CPI are forecast to rise by 0.2%. If this happens, the headline rate would edge higher to 3.2% YoY, while core inflation is expected to hold steady at 4.8%.
While inflation is likely at its peak, core inflation remains stubborn, and the Fed will want more confirmation in the upcoming months that progress is being made before concluding its rate-tightening cycle.
US CPI chart
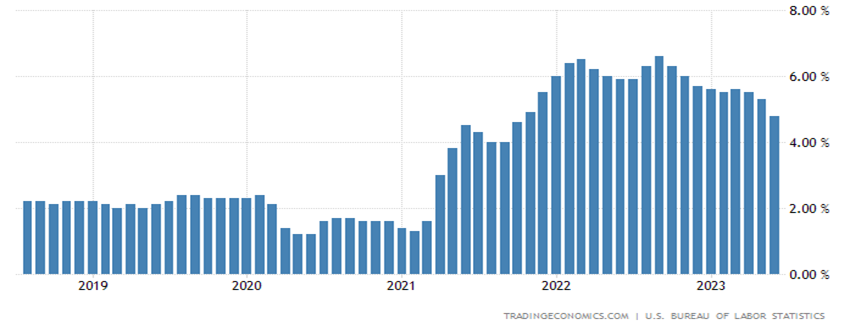
Source: TradingEconomics
-
UK
GDP
Friday, August 11 at 4 pm AEST
In the first three months of the year, the UK GDP grew by just 0.2%, and while the economy has managed to steer clear of a recession, growth remains sluggish over the past few months, which suggests that the UK economy is not out of the woods yet. Further trade-offs for growth conditions from tighter monetary policies will likely show up over the coming months as well.
This comes on the back of a cumulative 75 basis-point (bp) worth of tightening delivered by the Bank of England (BoE) in the second quarter, with little sign that the rate upcycle is coming to an end anytime soon. Rate expectations are still pricing for two more 25 bp hikes from the central bank by the end of this year.
The recent monthly GDP reading for May has fallen back into negative territory (-0.4%) for the first time in 2023, and while the drag is partly attributed to an extra national holiday from King Charles III's coronation, further clues will be sought from the upcoming GDP reading to give a clearer indication of how long the stagnating growth outlook will last.
UK GDP percentage year-on-year chart
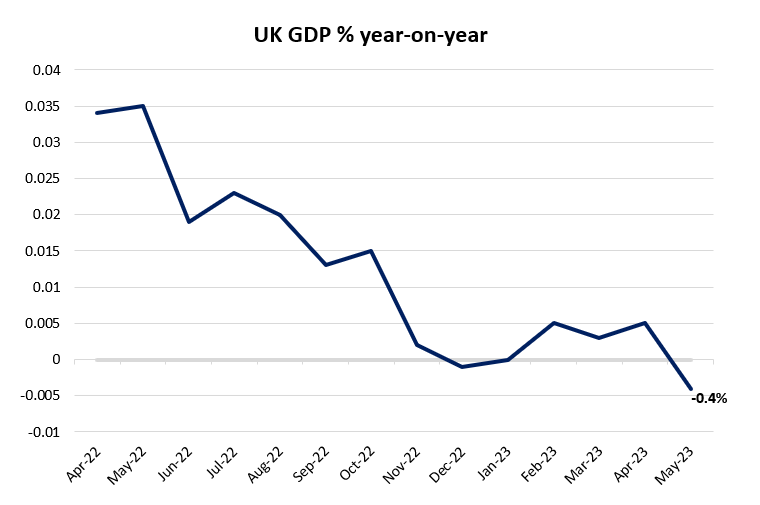
Source: Refinitiv
-
US
US Q2 2023 earnings
The Q2 2023 earnings season continues, and we can expect reports from several companies, including Walt Disney, Alibaba, Roblox, Trade Desk, Rivian, Palantir Technologies, and UPS.
For more insights, you can read our earnings preview of Walt Disney.

Source: Refinitiv
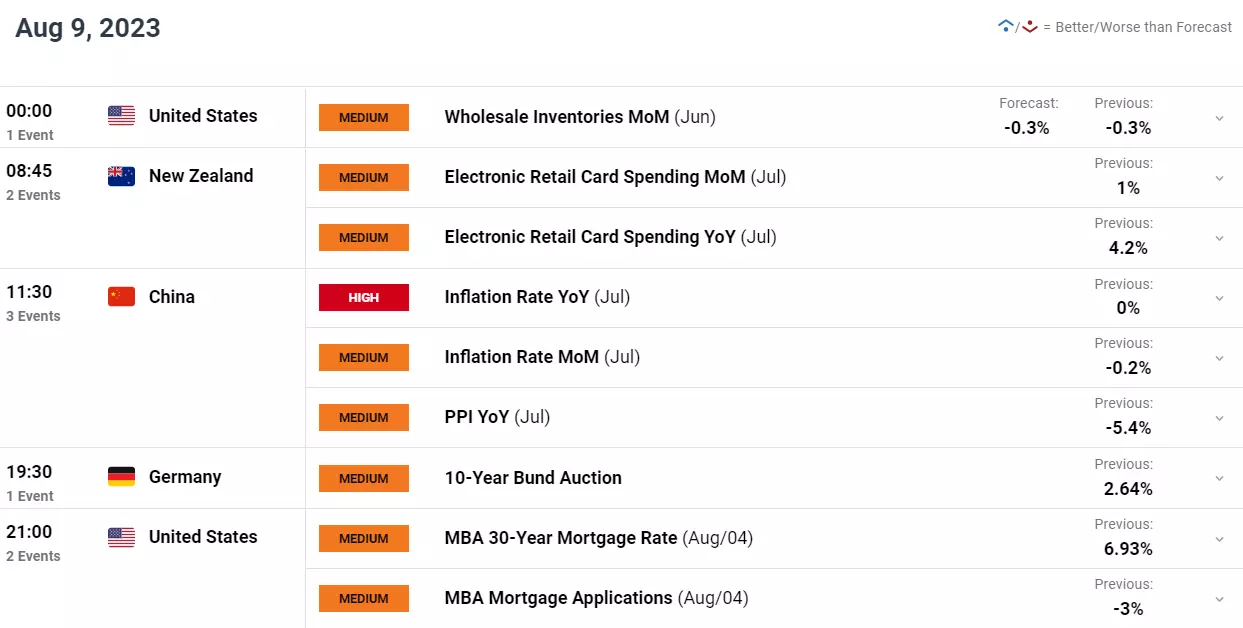
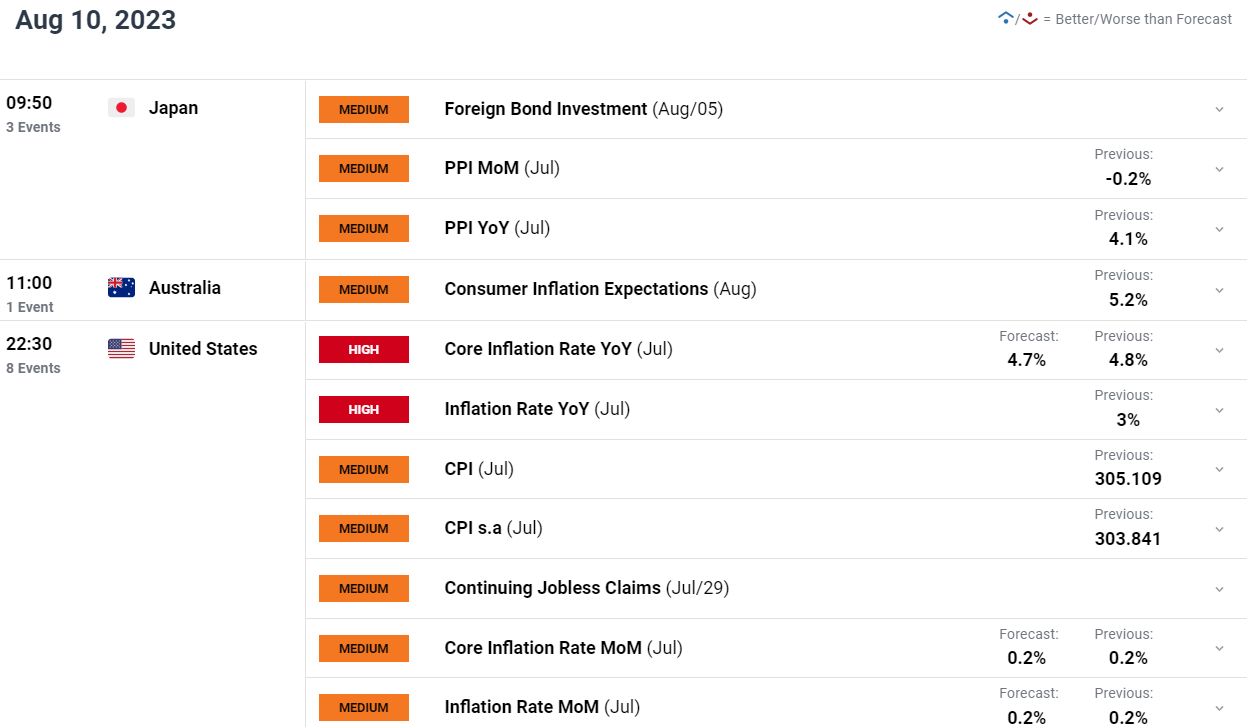
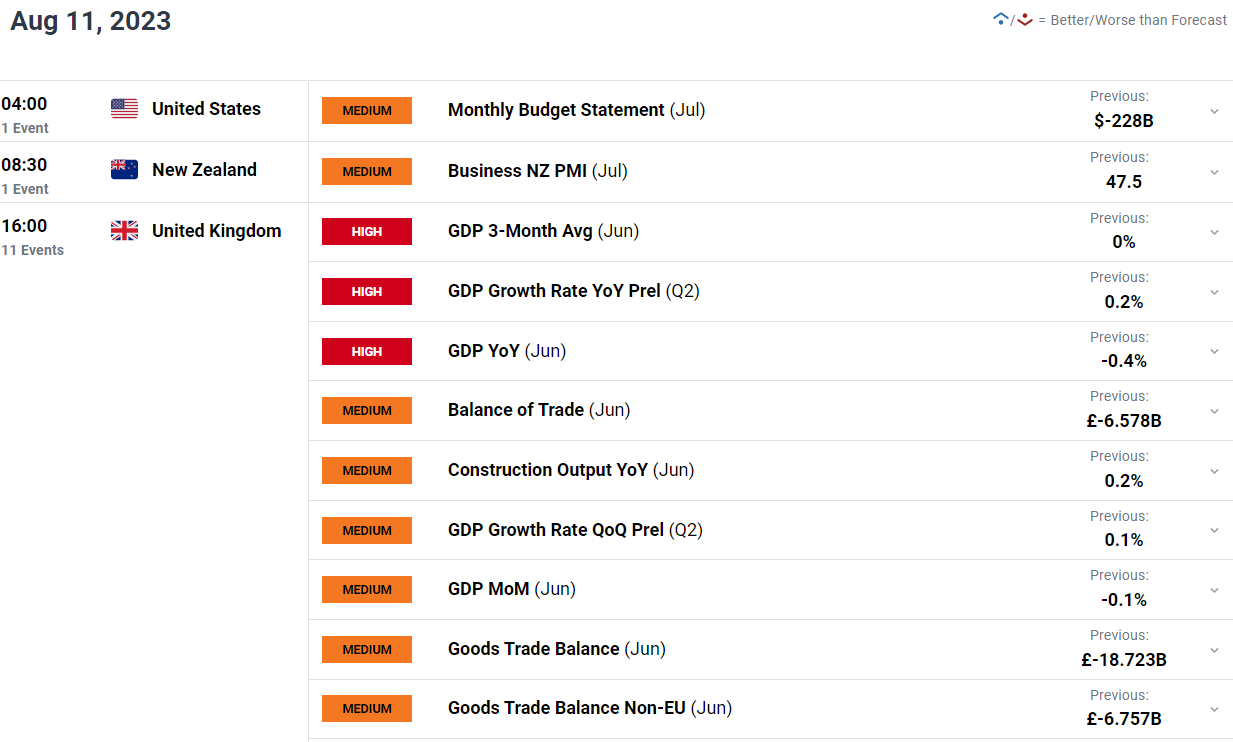
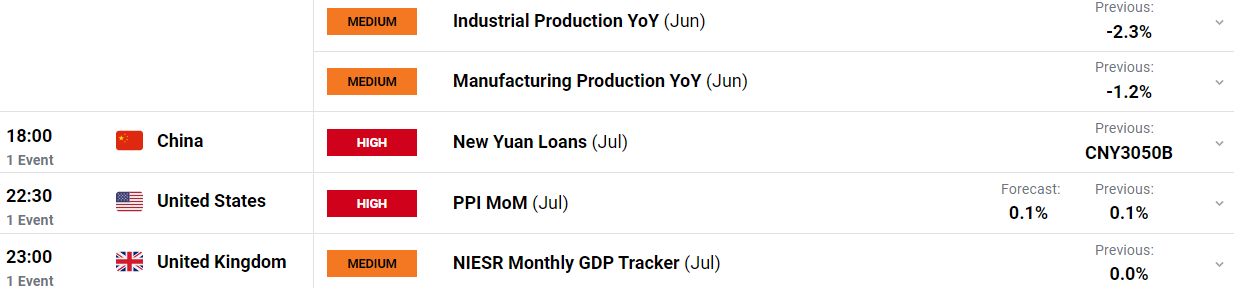
Economics calendar
All times shown in AEST (UTC+10) unless otherwise stated
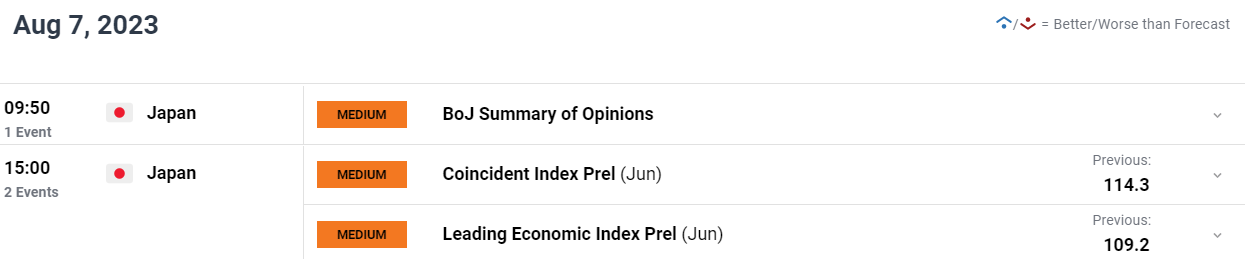
Source: DailyFX

Source: DailyFX
Source: DailyFX
Source: DailyFX
Source: DailyFX


0 Comments
Recommended Comments
There are no comments to display.
Create an account or sign in to comment
You need to be a member in order to leave a comment
Create an account
Sign up for a new account in our community. It's easy!
Register a new accountSign in
Already have an account? Sign in here.
Sign In Now