Dollar Traders Focused on Powell at Jackson Hole, EURUSD Capable of 1.1775-1.1650 Break?

Entry posted by MongiIG in Market News
800 views
S&P 500, VXX AND EURURSD TALKING POINTS
- Heading into the final trading day of the week – but still in the thick of the liquidity doldrums –Fed Chairman Powell’s statement and the PCE update are a beacon
- The S&P 500 and most other risk-leaning assets swooned this past session as market participants readied for this week’s top event risk
- Considering the Fed is actively attempting to avoid market volatility and there is still more than a week until the end of the market’s ‘summer’, is there potential for a serious trend?

A FINAL COURSE CHECK BEFORE TOP EVENT RISK…AND THE WEEKEND
We are finally heading into Friday trade. On the one hand, this is the last session of an otherwise reserved week; and we are very close to the seasonal pivot from typical quiet into more active trading conditions – usually the US Labor Day holiday which this year falls on September 6th. Then again, anticipation is a collective sentiment that is difficult to suppress, particularly when moving into highly anticipated event risk capable of stirring speculators to action. In the forthcoming US trading session, we will wade into the deep end of the Jackson Hole Economic Symposium’s scheduled meetings, including a highly-anticipated speech by none other than Fed Chairman Jerome Powell. There was recognition of the potential this past session as risk-leaning assets edge back from their highs. The S&P 500 dropped back -0.6 percent to break a five-day advance with about the same level of commitment of previous charges of similar girth.
Chart of the SPY S&P 500 ETF with Volume, 100-Day SMA and Consecutive Day Trends (Daily)
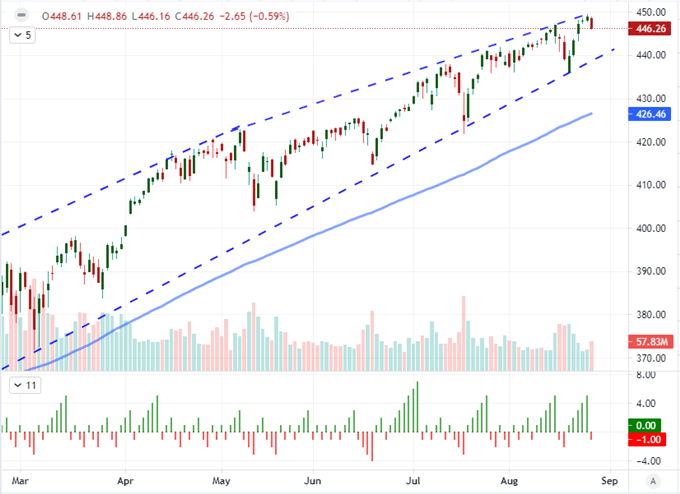
Chart Created on Tradingview Platform
There is some obvious expectation for market activity around this week-ending event risk beyond the modest set back in US indices. Implied volatility (which is another way of saying ‘expected volatility’), rose climbed 12 percent according to the VIX with a bump back up to 18.9 percent. Notably, the short-term volatility ETF VXX was also on the upswing with a more modest 4.3 percent advance from exceptionally low levels but with meaningful volume to support the move. These are still very reserved levels historically speaking, but the masses are not so confident in the general sense of quiet that market participants will simply hold on their costly exposures without some measure of hedge. Speaking of protection from the unexpected, the ‘trail risk’ index, also know as the SKEW, is relatively restrained at 157. It has ranged up to 160 since the beginning of July and hit a record high of 170 back in June.
Chart of VXX Short-Term Volatility ETF with 100-Day SMA and Volume (Daily)
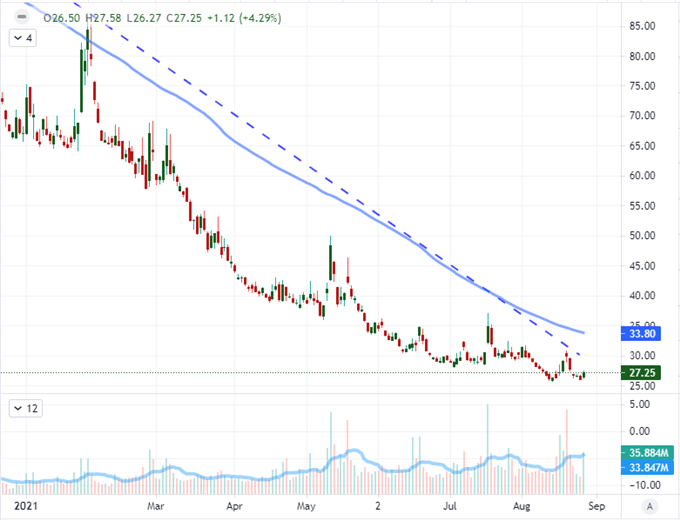
Chart Created on Tradingview Platform
WHAT TO EXPECT FROM JACKSON HOLE THROUGH FRIDAY
Wading into the global monetary policy event of the year, I do believe there is significant market-moving potential. That said, the Federal Reserve (Fed) and other key players in the global monetary policy authority have been remarkably explicit about their intentions with forward guidance. This is all in an effort to back out of an extreme position without causing a cascade of risk aversion as the deep-pocketed buyer exits the market. In the even that these policy officials are successful in withdrawing without causing serious fallout, we are still navigating through the most reserved period of the trading year. August is known as the lull of the calendar year (according to the S&P 500) and we are still more than a week out from the Labor Day holiday. Left to our own devices, complacency would readily see these markets settle into a holding pattern awaiting the next signal for serious launch.
Chart of S&P 500’s Performance, Volume and Volatility via VIX Per Calendar Month
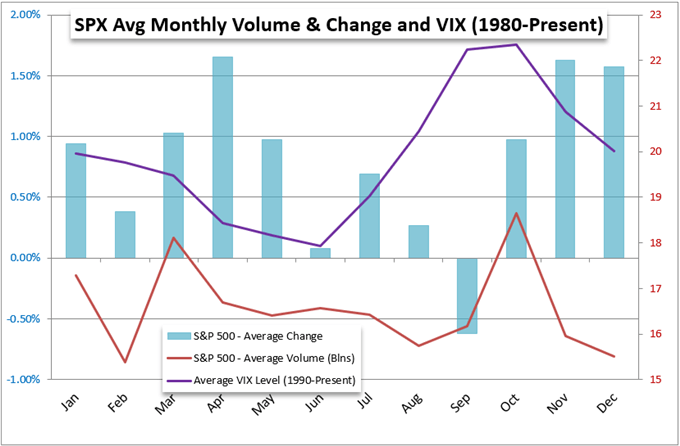
Chart Created by John Kicklighter with Data from Bloomberg
As much as the US central banks wants to project a slow and measured policy shift that is guided by a robust economic forecast, the markets are driven by their speculative interpretations and appetites. I am almost certain that Fed Chair Powell and his team are looking to ease the market into the reality that they intend to withdrawal from their exposure so that the markets can evaluate risk on their own terms. Yet, even if Powell deftly navigates the messaging gauntlet, speculative interpretation can readily take over. I will note that this past session three hawks – who are also non-voters in 2021 – made clear their belief that a taper should come as soon as the next meeting. Jackson Hole host Esther George, President of the Kansas City Fed, was the most measured in her statement saying a taper should come ‘sooner rather than later’. Meanwhile, Dallas Fed President Steven Kaplan and St Louis Fed President James Bullard made clear their believe that a taper should start with the September 22nd meeting and that bubbles were starting to form in the financial system. Is this a warning to the markets of Fed consensus or an effort by a minority to sway the group to action?
Table of the FOMC Members with Their Perceived Policy Bias
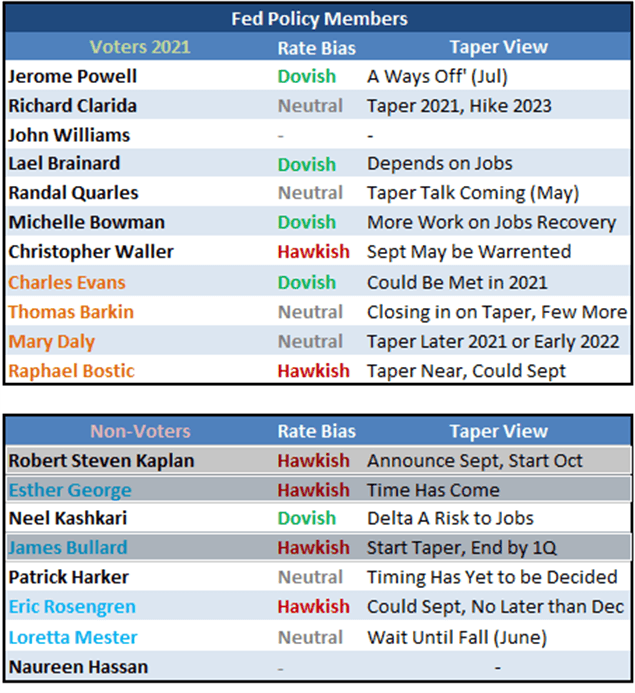
Chart Created by John Kicklighter
From a monetary policy perspective, it is important to consider the US central bank’s course not just from the internal dynamics and the eventual time frame for a taper – and longer term possibility for a rate hike. We should also register the path for the Fed relative to its major counterparts. This past session alone offered up some interesting perspective. The ECB leaned into its dovish views despite a few outlier hawkish voices according to its monetary policy minutes while the South Korean central bank actually hiked rates 25 basis points to 0.75 percent, though the Won actually dropped. The Fed isn’t the only game in town, but its policy decisions stretch far beyond its own financial borders.
Chart of Perceived Monetary Policy Standing of Major Central Banks (Daily)
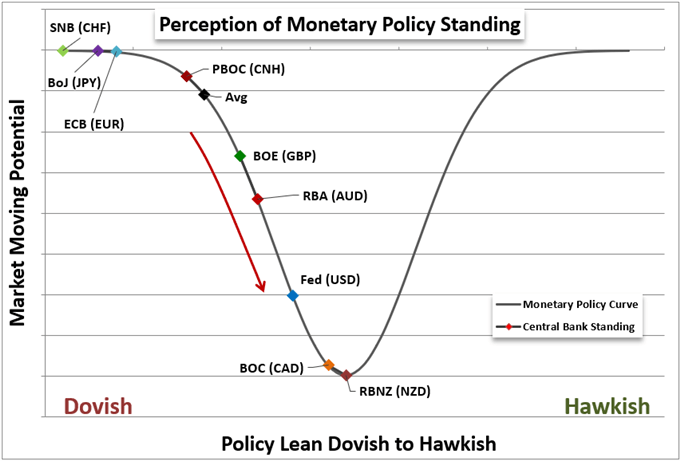
Chart Created by John Kicklighter
EURUSD STILL TOPS MY WATCH LIST
There are quiet a few interesting assets and pairs to watch as we evaluation the take on US monetary policy. Aside from the US indices, I will also be keeping very close tabs on US Treasury yields and Fed Funds futures. These markets are about as close as you will get to pricing in immediate rate speculation. For the Dollar’s part, I think many of the so-called majors are interesting on a technical basis, but there isn’t a balanced bullish and bearish potential from most. If Powell were able to follow in the footsteps of the South Korean central bank and urge the market to see a dovish outlook despite a recognizable hawkish shift (taper warning versus an actual hike), I like a technical vehicle like EURUSD beak above 1.1775. If the Dollar were to actually advance, my expectations for an outright trend are low. Therefore, the range picture from GBPUSD (down to 1.3600), AUDUSD (down to 07100) and USDCAD (up to 1.2850) are of top interest.
Chart of EURUSD with 50-Day SMA and 20-Day ATR (Daily)
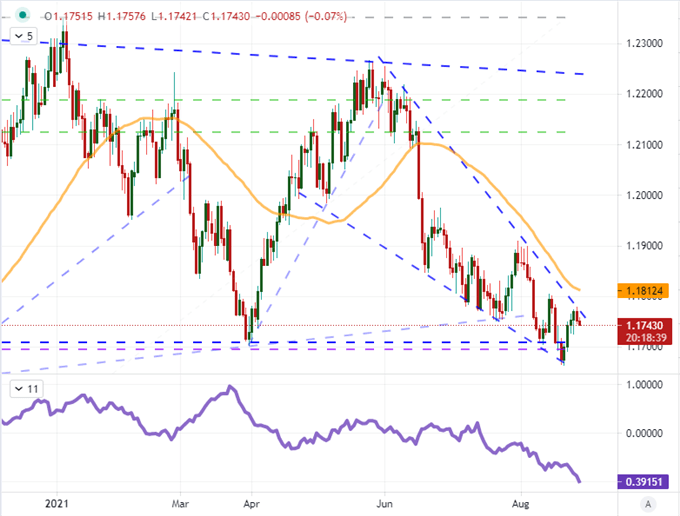
Chart Created on Tradingview Platform
By John Kicklighter, Chief Strategist, 27 August 2021. DailyFX


.jpeg.98f0cfe51803b4af23bc6b06b29ba6ff.jpeg)


0 Comments
Recommended Comments
There are no comments to display.
Create an account or sign in to comment
You need to be a member in order to leave a comment
Create an account
Sign up for a new account in our community. It's easy!
Register a new accountSign in
Already have an account? Sign in here.
Sign In Now