Is Alibaba’s share price a buy?

Entry posted by MongiIG in Market News
1,218 views
With Alibaba’s share price falling close to 35% year-to-date, will it stage a recovery in the coming months?
 Source: Bloomberg
Brief overview
The ongoing theme putting a cap on Alibaba’s share price continues to be the tightening of regulations by Chinese authorities, bringing about some near-term impact on profitability and operational restructuring. Alibaba has also pledged US$15.5 billion in support of "common prosperity", raising questions of whether there will be further ‘sharing’ of profits to align with the government’s long-term goals.
What may we expect?
China’s data protection law requires Internet companies to obtain customer consent for more targeted feeds and ads. While the rate of opt-out remains to be seen, the broad-based implementation levels the playing field for all. The impact on the e-commerce space, however, may potentially be softer, considering that consumers may be more willing to be fed with relevant product ads for shopping comparison.
While the ‘common prosperity’ theme will continue to linger, it may be aimed at promoting a more sustainable economy by increasing the contribution of household consumption to economic growth. While pledging of huge investment amounts may reduce shareholder return in the near term, markets participants may have to be in for the long haul for it to crystalise.
Alibaba’s retail marketplaces may potentially lead to some stickiness by vendors, having a massive scale of 828 million annual active consumers. While China’s aim to open up competition is a concern to some, it can come as a double-edged sword. Sharing of content with rivals’ apps, such as Tencent’s WeChat, may bring about opportunities to tap on the 1.25 billion monthly active users for expansion or monetisation.
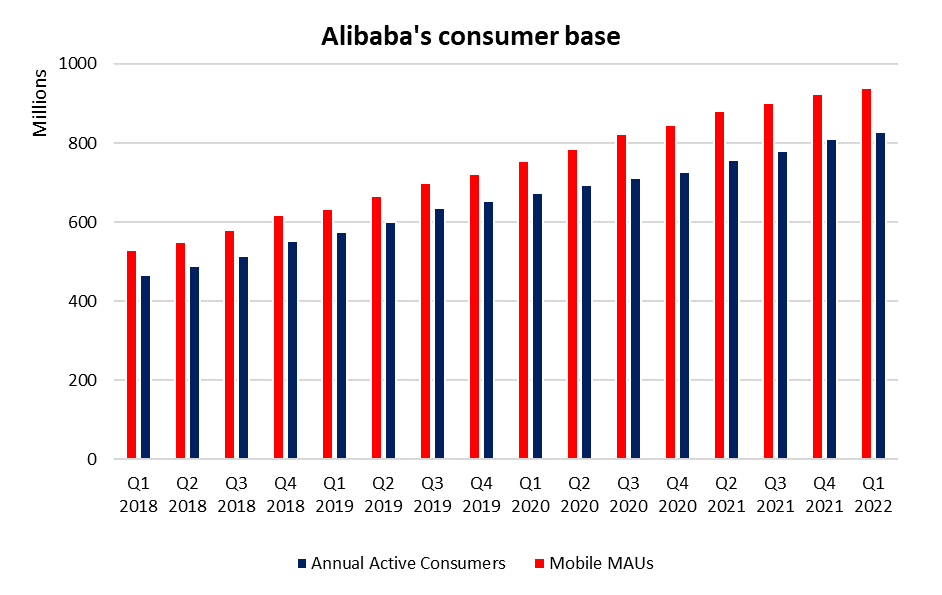 Source: Alibaba
Policy support for China’s slowing retail sales?
Recent China’s retail sales data revealed only a 2.5% year-on-year increase in August, far short of the 7.0% expected, with Covid-19 restrictions and supply constraints singled out as the main culprits. That said, online retail sales of physical goods post a relatively smaller decline, coming in at a 15.9% increase from the previous year. That may suggest some resilience for online consumer demand, potentially cushioning any slowdown in retail sales for the e-commerce players.
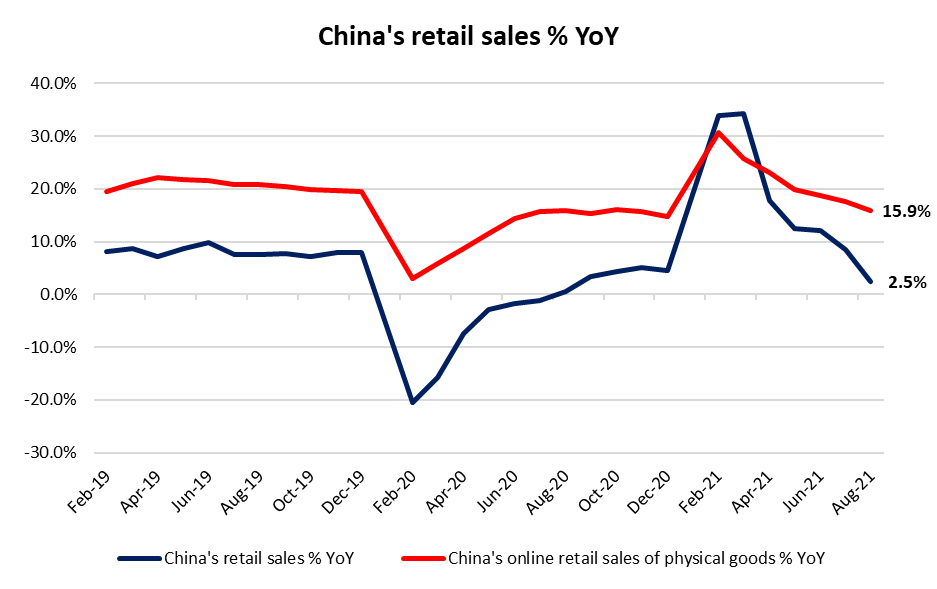 Source: National Bureau of Statistics of China
While contagion risks from Evergrande remain a threat to economic growth, recent injection of short-term funds into the financial system by China’s central bank provides an optimistic signal that they are ready to step in if the economy comes under risk. Further growth slowdown over the coming quarters may reinforce the stance for more policy support, with expectations for another reserve requirement ratio cut to support growth. Along with Covid-19 measures largely being temporary, subsequent easing of restrictions may provide a positive backdrop for consumer spending.
Price performance and valuation
Forward profitability metrics may carry some uncertainties near-term from regulatory risks. That said, its price-to-book currently trades at 2.70, more than two standard deviations below its five-year average. That marks its lowest level since listing, also trailing behind its e-commerce peers such as JD.com (3.51) and Pinduoduo (12.03).
Compared to other Chinese big techs, Alibaba also carries a weaker year-to-date price performance, as markets seem to be pricing higher regulatory risks on its businesses. Greater clarity on the impact to its profitability over the next few quarters may potentially lead to a re-rating of its valuation ahead.
Technical analysis
Alibaba’s share price continues to trade in a downtrend, with a series of lower highs and lower lows since October last year. A downward trendline has weighed on its share price on five occasions since June, which will be a key resistance to overcome for a longer-term upside move.
Recent lower low for share prices is met with a higher low on the moving average convergence divergence indicator, which may suggest weakening downside momentum and increasing chances of a short-term rebound. Immediate resistance may be at HKD150.00, where a breakdown of previous support level will now serve as resistance.
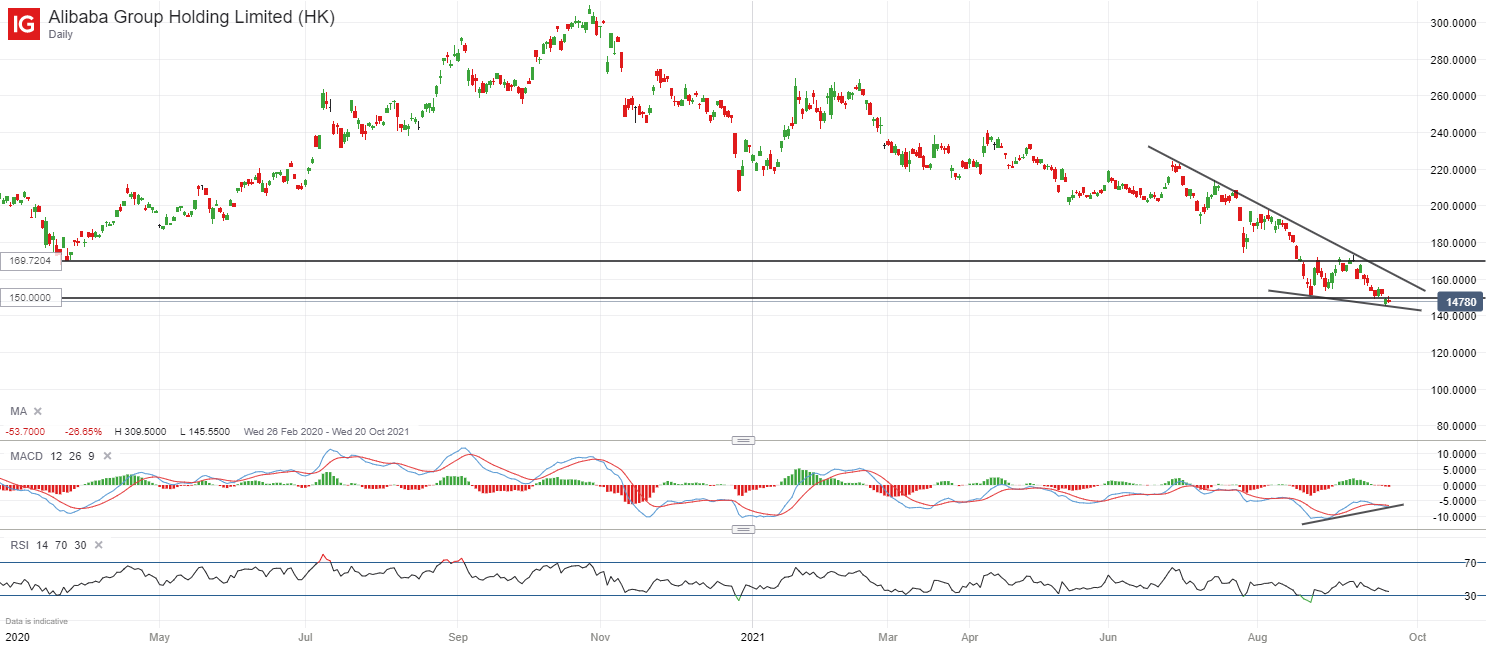 Source: IG Charts


.jpeg.98f0cfe51803b4af23bc6b06b29ba6ff.jpeg)

0 Comments
Recommended Comments
There are no comments to display.
Create an account or sign in to comment
You need to be a member in order to leave a comment
Create an account
Sign up for a new account in our community. It's easy!
Register a new accountSign in
Already have an account? Sign in here.
Sign In Now