Jump to content

British Pound (GBP) Price Outlook: GBP/USD Downtrend May Resume


MongiIG

615 views

GBP PRICE, NEWS AND ANALYSIS:

  • After its decent rally since the end of last month, GBP/USD now looks likely to fall back, although it could remain around the 1.36 level for a while first.
  • Talk in the UK media of stagflation persists, and a dire set of new car registration figures will do nothing to counter that narrative.

GBP/USD: Pound - Dollar Rate, Chart, Forecast & Analysis


GBP/USD COULD HOLD STEADY, THEN DROP

GBP/USD is in an interesting position, having rallied from the September 29 low at 1.3412 to around 1.36. Near-term it could well stay close to that level but further losses afterwards cannot be ruled out.

GBP/USD PRICE CHART, DAILY TIMEFRAME (APRIL 22 – OCTOBER 5, 2021)

Latest GBP/USD price chart.

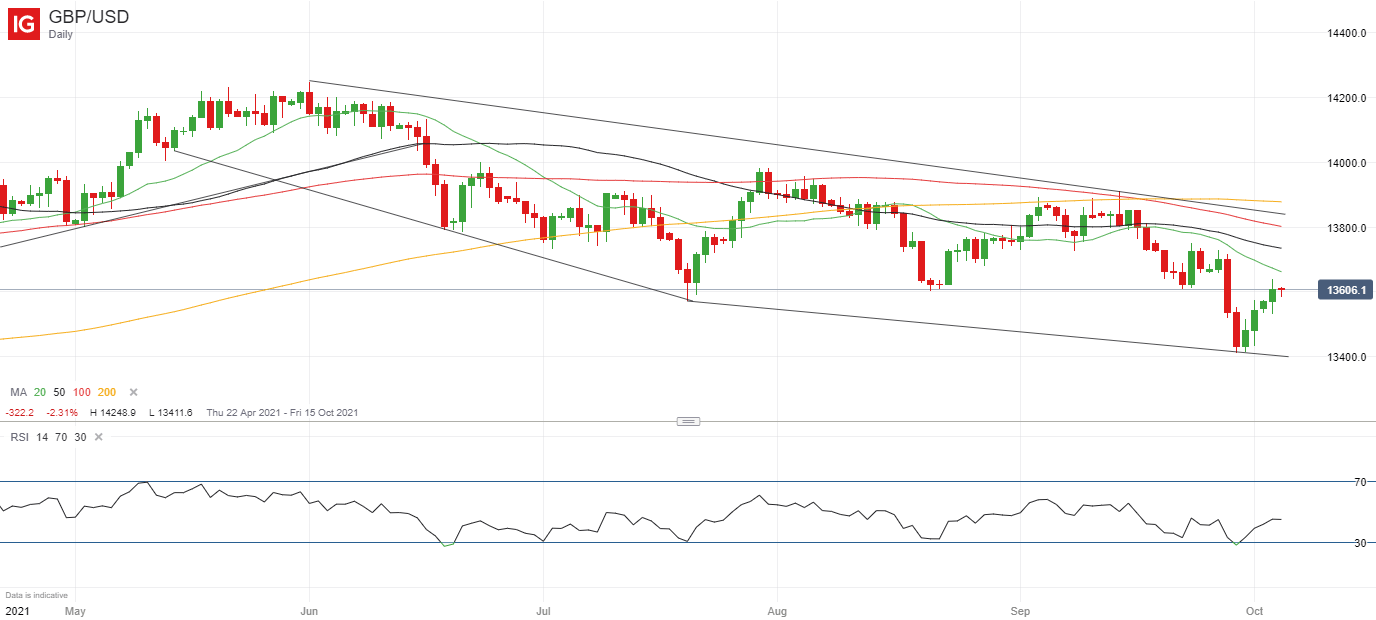
Source: IG (You can click on it for a larger image)

UK NEW CAR REGISTRATIONS TUMBLE

A key talking point in the UK media – although less so in the markets – is the threat of stagflation in the UK caused by weak growth and strong inflation. That narrative was fed Tuesday by news that British new car registrations fell last month by 35% year/year to 214,000 units, according to preliminary data from the Society of Motor Manufacturers and Traders that marked the weakest September for at least 23 years.

The SMMT added that the vehicle industry continued to be plagued by a global shortage of semiconductors used in car production.

The strong crude oil price is also fuelling inflation expectations at a time when supply-chain disruptions continue to plague the supply of fuel to petrol stations in London and the south-east of England.


Written by Martin Essex, Analyst, 5th October 2021. DailyFX

0 Comments


Recommended Comments

There are no comments to display.

Create an account or sign in to comment

You need to be a member in order to leave a comment

Create an account

Sign up for a new account in our community. It's easy!

Register a new account

Sign in

Already have an account? Sign in here.

Sign In Now
  • Blog Statistics

    • Total Blogs
      3
    • Total Entries
      2,822
  • Latest Forum Topics

  • Our picks

    • International Workers' Day & Early May Trading Hours
      Please be advised that our opening hours will be adjusted on 1 May 2024 for International Workers’ Day and 6 May 2024 for the UK Early May Bank Holiday. Where appropriate, the times listed are in GMT.
        • Like
    • Are these the best AI stocks to watch in May 2024?
      Microsoft, Apple, Nvidia, Amazon and Meta could be the best AI stocks to watch next month. These stocks are the largest AI stocks in the US based on market capitalisation.
    • Natural Gas Commodity Elliottwave Technical Analysis
      Natural Gas


      Mode - Impulsive 


      Structure - Impulse Wave 


      Position - Wave (iii) of 5


      Direction - Wave (iii) of 5 still in play


      Details:  Price now in wave iii as it attempts to breach 1.65 wave i low. Wave (iii) is still expected to extend lower in an impulse.


      Natural Gas is currently breaching the previous April low, marking a decisive move as the impulse initiated on 5th March continues its downward trajectory, further extending the overarching impulse wave sequence that commenced back in August 2022. This decline is anticipated to persist as long as the price remains below the critical resistance level of 2.012.


      Zooming in on the daily chart, we observe the medium-term impulse wave originating from August 2022, which is persisting in its downward trend after completing its 4th wave - delineated as primary wave 4 in blue (circled) - at 3.666 in October 2023. Presently, the 5th wave, identified as primary blue wave 5, is underway, manifesting as an impulse at the intermediate degree in red. It is envisaged that the price will breach the February 2024 low of 1.533 as wave 5 of (3) seeks culmination before an anticipated rebound in wave (4). This confluence of price movements underscores the bearish sentiment prevailing over Natural Gas in the medium term.


      Analyzing the H4 chart, we initiated the impulse wave count for wave (3) from the level of 2.012, which marks the termination point of wave 4. Notably, price action formed a 1-2-1-2 structure, with confirmation established at 1.65 and invalidation set at 2.012. The confirmation of our anticipated direction materialized as price breached the 1.65 mark, signifying a resumption of bearish momentum. Presently, there appears to be minimal resistance hindering the bears, thereby reinstating their dominance in the market. It is projected that wave iii of (iii) of 5 will manifest around 1.43, indicative of the potential for the wave 5 low to extend to 1.3 or even lower. This comprehensive analysis underscores the prevailing bearish outlook for Natural Gas in the immediate future.


      Technical Analyst : Sanmi Adeagbo
       
        • Like
×
×
  • Create New...
us