Gold Prices May Fall on Rosy NFPs after US Senate Temporarily Lifted Debt Ceiling
GOLD, XAU/USD, TREASURY YIELDS, NON-FARM PAYROLLS, US DOLLAR, TECHNICAL ANALYSIS - TALKING POINTS:
- Gold prices fall, Treasury yields rise on interim US debt ceiling solution.
- An upbeat non-farm payrolls report risks accelerating XAU/USD losses.
- Falling Wedge breakout losing momentum, retail traders reduce short bets.

Gold prices aimed cautiously lower over the past 24 hours. The anti-fiat yellow metal was left vulnerable as the ongoing rise in Treasury yields dampened the appeal of the non-interest-bearing asset. Still, it could have been worse. A slightly softer US Dollar worked to cushion the XAU/USD’s downside potential. The haven-linked currency was likely pressured by improving risk appetite as the S&P 500 climbed.
Markets likely welcomed the near-term solution to the US debt ceiling. During Friday’s Asia-Pacific trading session, the Senate extended the cap to December 3rd. That reduced the risk of default, lifted uncertainty and boosted market sentiment. Meanwhile, a pullback in natural gas prices may have also played a role in bolstering risk appetite. Russia seemingly hinted at increasing supplies to Europe.
All eyes turn to the US non-farm payrolls report as traders head into the weekend. The Citi Economic Surprise Index is up to -15.50 from a low of -61.60 in September. In other words, while economists are still underestimating the health and vigor of the economy, this has been by an increasingly smaller margin. A relatively rosier outcome compared to the August print may keep bond yields elevated, pressuring gold.
Check out the DailyFX Economic Calendar for more key events!
GOLD TECHNICAL ANALYSIS
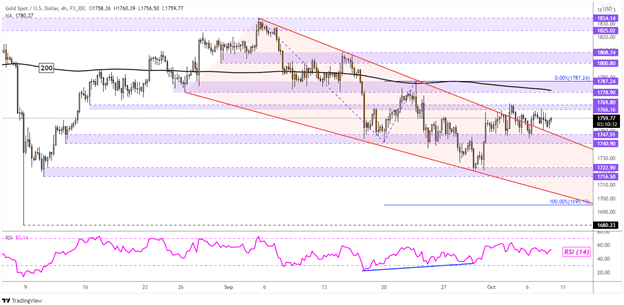
On the 4-hour chart, gold prices have been consolidating between the 1769 – 1766 and 1740 – 1747 inflection zones since late September. XAU/USD appeared to break above a bullish Falling Wedge chart formation, but follow-through has been lacking. That is undermining the breakout. A push lower exposes the September low. Otherwise, a climb places the focus on the 200-period Simple Moving Average.
XAU/USD 4-HOUR CHART

Chart Created Using TradingView
GOLD SENTIMENT ANALYSIS
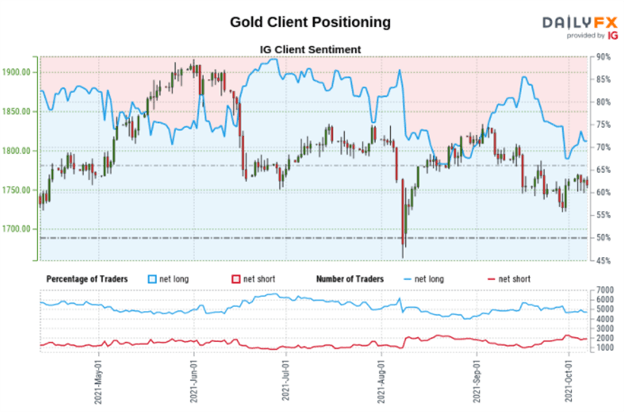
According to IG Client Sentiment (IGCS), about 74% of retail traders are net-long gold. Downside exposure has decreased by 5.68% and 20.23% over a daily and weekly basis respectively. We typically take a contrarian view to crowd sentiment. Since most traders are net-long, this suggests gold may continue falling. Recent shifts in positioning are further underscoring a bearish contrarian trading bias.

*IGCS chart used from October 7th report
Written by Daniel Dubrovsky, Strategist for DailyFX.com. 8th October 2021


0 Comments
Recommended Comments
There are no comments to display.
Create an account or sign in to comment
You need to be a member in order to leave a comment
Create an account
Sign up for a new account in our community. It's easy!
Register a new accountSign in
Already have an account? Sign in here.
Sign In Now