Lumber bulls start to emerge, with seasonality signalling potential strong Q4

Entry posted by MongiIG in Market News
1,147 views
Lumber spike highlights potential for a bullish resurgence, with seasonality pointing towards a strong Q4.
 Source: Bloomberg
Lumber finally starts to turn a corner
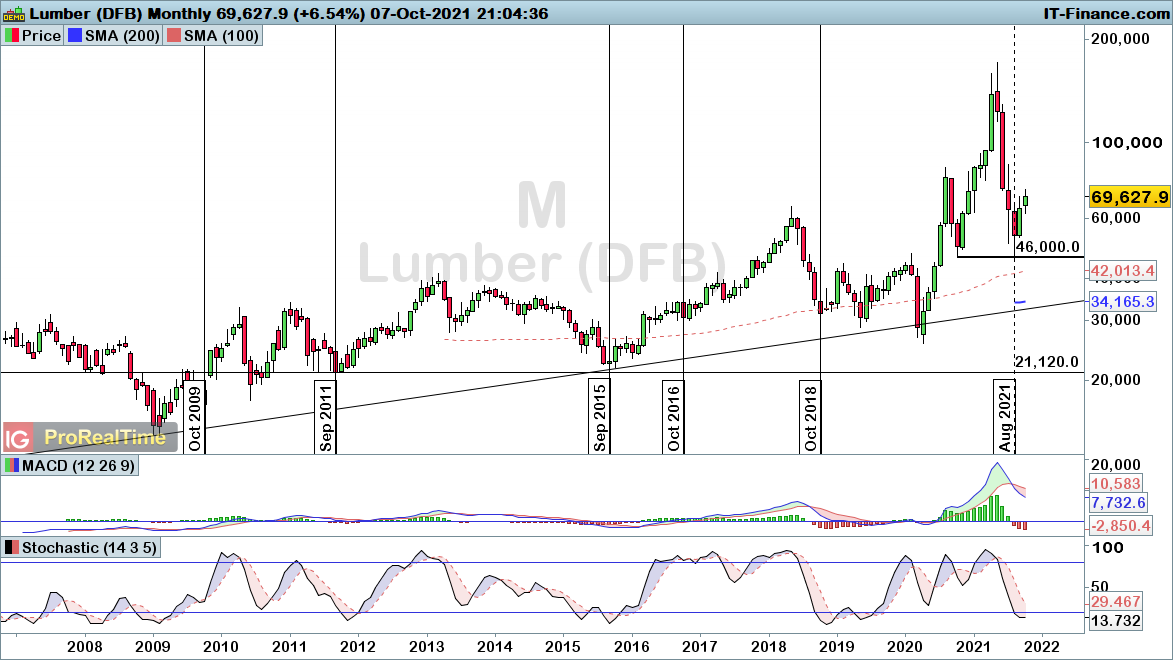
Lumber has seen huge volatility over the course of the pandemic, with an initial 45% decline, followed up by a whopping 564% bull run that ended in May.
The past few months have been less welcome for bulls, with the price of lumber losing 73% in little more than three months. However, as highlighted a month ago, this pullback does look likely to represent a potential buying opportunity before long.
The long-term picture remains bullish despite this recent collapse, with the trend of higher lows firmly intact. A break below $257 would be required for that to occur.
With that in mind, we are looking for a bullish reversal signal to come into play between here and $257. As such, the recent spike from $460 looks like a particularly interesting possible reversal point.
 Source: ProRealTime
10% rise signals potential return of the bulls
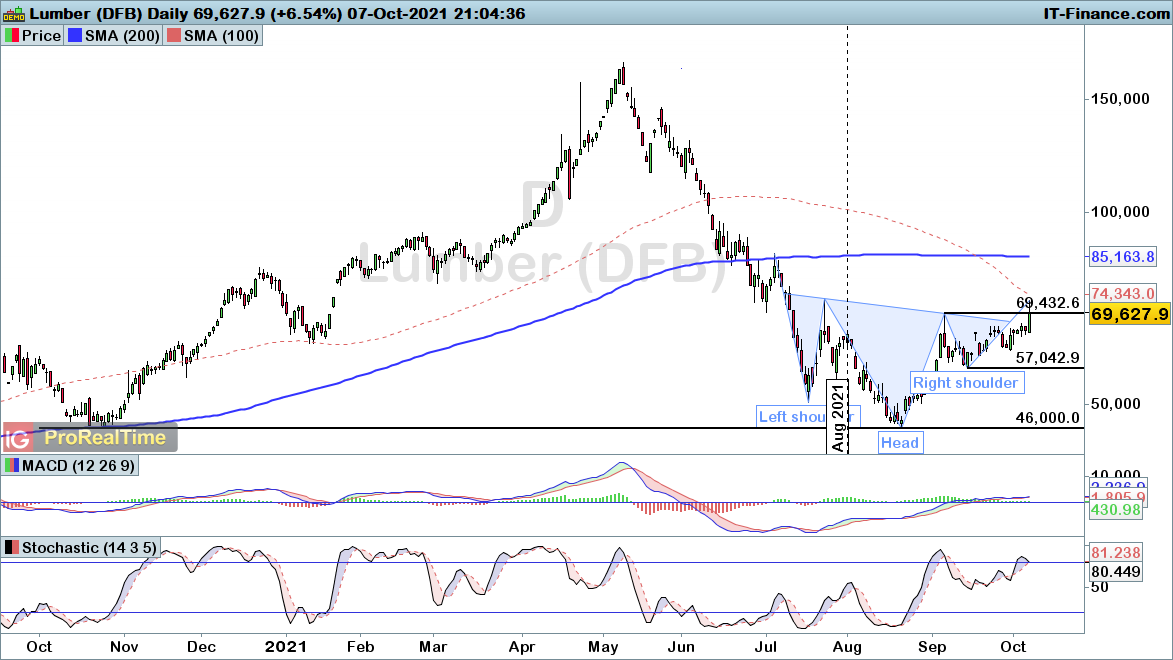
The daily chart highlights how lumber has broken from its recent downtrend, with price pushing up through trendline resistance. However, hurdles do lie up ahead as the trend of lower highs remains unbroken.
A rise through the $732 level would bring that bullish break, yet short-term upside still looks likely as we push towards near-term resistance of $667.
 Source: ProRealTime
Seasonality highlights potential for Q4 rebound
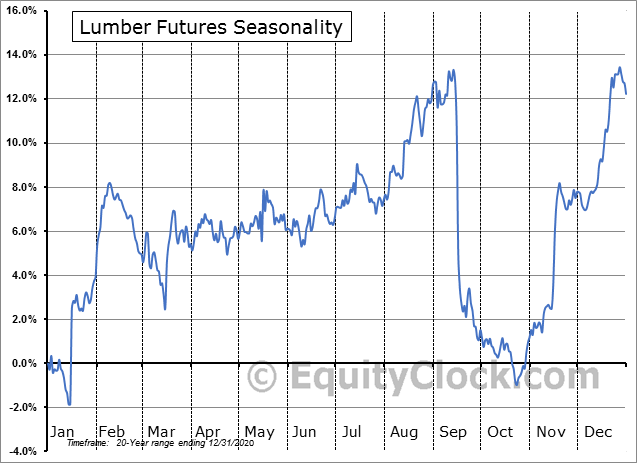
Once again, it is worthwhile to note the seasonality chart for lumber, with the fourth quarter (Q4) typically representing the source of a final end of year push higher.
The chart below highlights that we often see major volatility in the second half of the year when looking at the past 20-years. That typically takes the form of Q3 weakness and a Q4 recovery, signalling the potential for us to start building a base over the course of September for an ultimate push higher later in the year.
The ability to break $732 will be key in determining whether such a move will happen sooner or later.
 Source: EquityClock
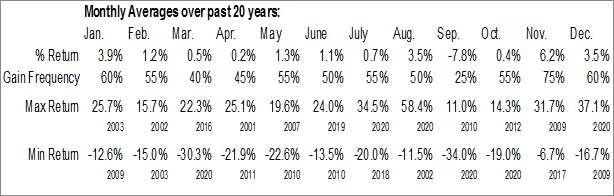
The statistical breakdown does provide some clues as to how that chart is constructed.
Despite the strong start this month, September is statistically the weakest month over the past 20-years. An average return of -7.8% comes with a win rate of just 25%. If we were to maintain this recovery from here on, it would smash the record 11% September gain seen in 2010.
It is worthwhile noting that the particularly damaging -34% move seen last year will have heavily influenced the average. Nonetheless, what we are seeing is a move towards a particularly strong three-month period to close out the year, with November seeing the most reliable month given the 75% gain frequency rate.
November has also seen the least downside, with the 2017 decline of -6.7% representing the worst November over the course of two decades.
With this in mind, there are still some question marks over whether the recovery comes into play here or whether this is simply the opening salvo in a bullish turnaround that could gather momentum towards the back end of the year. I
n any case, this latest period of weakness does look like something that will ultimately resolve with another push higher, yet key hurdles remain up ahead before we can gain strong confidence that we have bottomed out.


0 Comments
Recommended Comments
There are no comments to display.
Create an account or sign in to comment
You need to be a member in order to leave a comment
Create an account
Sign up for a new account in our community. It's easy!
Register a new accountSign in
Already have an account? Sign in here.
Sign In Now