Uber Technologies: Q3 earnings preview

Entry posted by ArvinIG in Analyst article
1,588 views
Uber Technologies results expected to show a smaller loss and move closer towards profitability.

Source: Bloomberg
When are the Uber results?
Uber Technologies, the company that connects consumers with of ride services, merchants and food delivery services as well as public transportation networks is set to report thitd quarter (Q3) 2021 earnings on 4 November 2021.
What ‘the Street’ expects from Uber Q3 2021 results?
In Uber’s preceding quarterly results (Q2 2021) the group has guided that it expects to reach adjusted earnings before interest, tax, depreciation and amortisation (EBITDA) profitability by Q4 2021, and is expecting the current reporting quarter to reflect an EBITDA loss of less than $100 million.
The current reporting quarter (Q3 2021) will have investors looking at the groups progress towards achieving profitability. Consensus estimates show ‘The Street’ to be more optimistic than Uber in terms of expecting an EBITDA loss of less than $50 million (Uber’s guidance less than $100 million EBITDA loss).
A consensus of estimates from Refinitiv data for the upcoming Q3 2021 Uber results arrive at the following:
- Revenue for the quarter of $4.421 million (+42.1%)
- EBITDA loss of $47.86 million (+92.34%)
- Earnings per share (EPS) for the quarter of -$0.34 (+45.94%)
How to trade Uber results
In terms of an institutional view, as of 20 October 2021, a Refinitiv poll of 48 analysts have an average rating of ‘buy’ for Uber, with a long-term price target (mean) of $67.15.
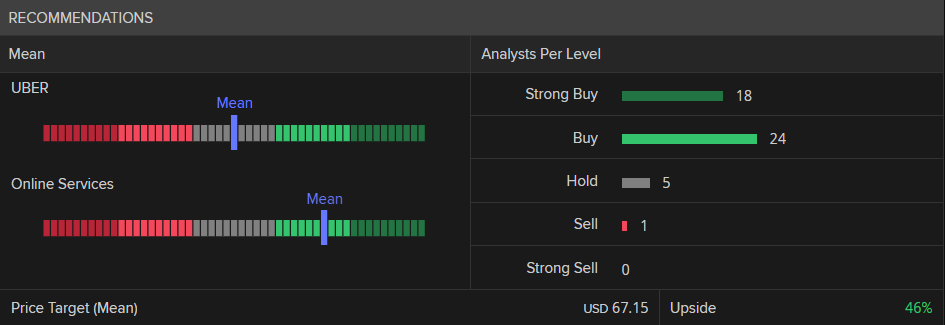
Source: Refinitiv
In terms of a retail trading view, as of 27 October 2021, IG Client Sentiment data shows 93% of IG clients with open positions expect the price to rise in the short term, while 7% expect the price to fall in the near term.
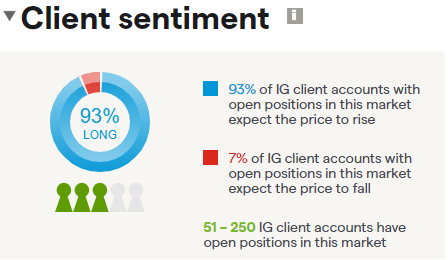
Source: IG
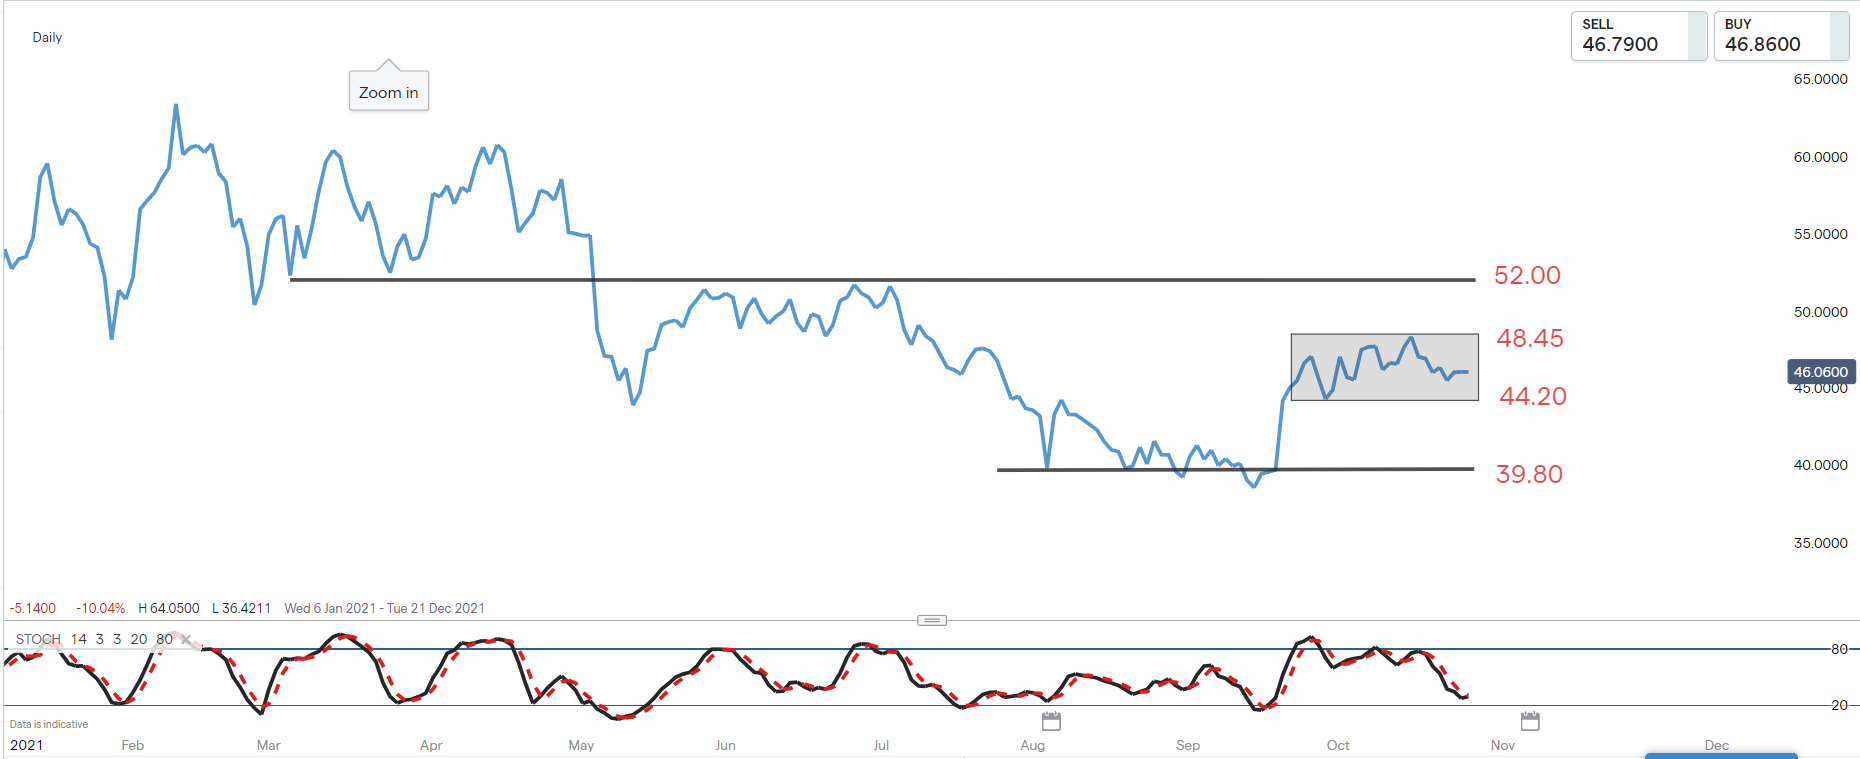
Source: IG charts
The share price of Uber currently trades within a short term range between levels 44.20 (support) and 48.45 (resistance). The longer term trend bias remains sideways as well.
Bullish trade scenario
Traders looking for long entry might prefer to see either a bullish price reversal closer to support (44.40) or an upside breakout of the 48.45 level (confirmed with a close above). In the event of an upside breakout, 52.00 becomes the initial upside target from the move.
Bearish trade scenario
Traders looking for short entry might prefer to see either a bearish price reversal closer to resistance (48.45) or a downside breakout of the 44.20 level (confirmed with a close below). In the event of a downside breakout, 39.80 becomes the initial downside target from the move.
Summary
- Q3 2021 results are scheduled for release on 4 November 2021
- Market participants will be looking for earnings to reflect an improving loss making scenario and a move closer towards profitability in the Q4 2021
- Revenue for the quarter of $4.421 million is expected by ‘The Street’
- A loss per share for the quarter of $0.34 is expected by ‘The Street’
- The average long term broker rating for Uber is ‘buy’
- The majority of IG clients with open positions on Uber expect the price to rise in the near term
- The share price remains rangebound in the short and long term
Shaun Murison | Senior Market Analyst, Johannesburg
29 October 2021


0 Comments
Recommended Comments
There are no comments to display.
Create an account or sign in to comment
You need to be a member in order to leave a comment
Create an account
Sign up for a new account in our community. It's easy!
Register a new accountSign in
Already have an account? Sign in here.
Sign In Now