Introduction to Multi-Time Frame Analysis

Entry posted by MongiIG in Analyst piece
2,388 views

AN INTRODUCTION TO MULTI-TIME FRAME ANALYSIS
Multi-time frame analysis (also known as multiple time frame analysis) allows traders to focus on the appropriate timing of trades as well as help identify when trends may be reaching exhaustion. This article will explain how to utilize this methodology with the forex pair EUR/AUD.
BENEFITS OF MULTI-TIMEFRAME ANALYSIS
As explored in previous articles on trendlines and pitchforks / median-lines are used to locate key reaction zones in price. These same principles can be applied to multiple time frames to offer a more complete view of current market trends.
The idea is to, ‘see the forest through the trees’ – in other words, before entering a trade based on a given setup, you will always want to have a broader opinion of where the market is relative to trend. By viewing price action in various timeframes we can identify possible entry points within a given price advance / decline as well as help in timing these moves.
EURAUD DAILY
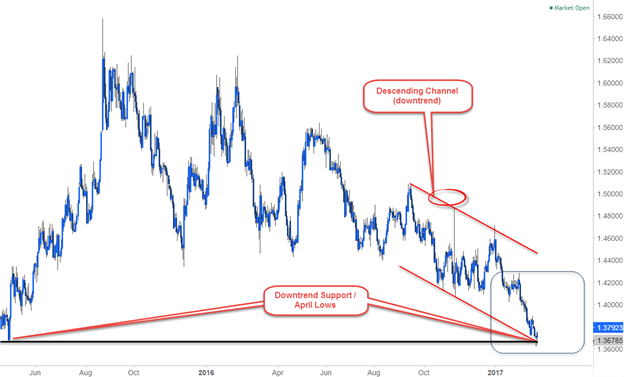
Consider the EURAUD daily chart above- The pair was trading in a clear downtrend off the 2015 highs with a descending channel formation highlighting support into the April lows around 1.3678. As discussed in earlier lessons, the confluence of trendlines & key high / lows in price will often represent more significant areas of support & resistance. In this example, price is testing down-trend support – the focus now shifts to the near-term picture for further clarity on how we would trade this possible rebound.
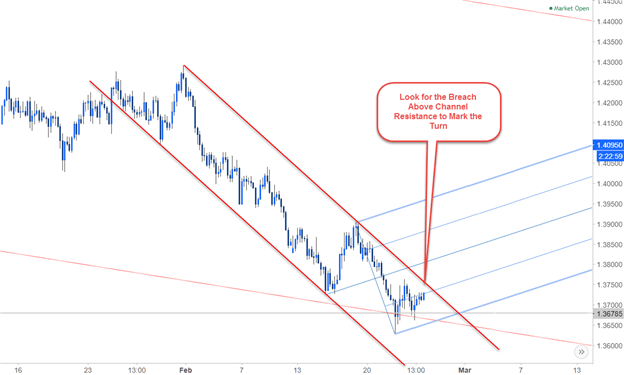
Just because price is at support, doesn’t mean we can simply assume it will hold. Prices need to establish some form of behavioral change before we can look to trade against the broader trend. As we drill down into the 4-hour chart, an embeddednear-term descending channel formation can be identified (red). A break above channel resistance as price comes off key support would shift the near-term focus higher in the pair and will serve as our ‘trigger’ to get into the trade.
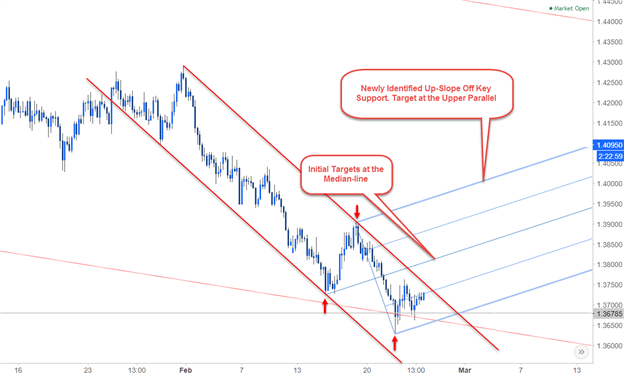
To identify our topside targets, we can derive an ascending pitchfork formation off the most recent low-high-low to construct an up-slope. The initial target on such a trade would be at the median-line (bisector) of the pattern with the focus weighted to the topside while above the lower median-line parallel.
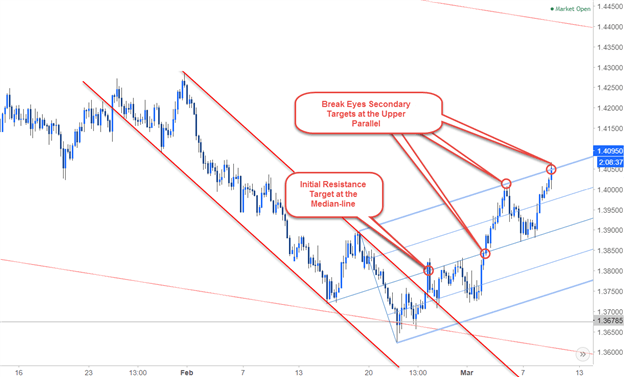
Fast forward a few weeks and the pair indeed broke above down-channel resistance and came back to test that line as support (long-entry). The advance continued into the median-line followed by a break and rally into the upper median-line parallel a few days later. This simple example illustrates how analyzing price action through various lenses of time can help identifying trading opportunities within the context of a larger trend (also called primary trend). Oftentimes secondary (or even tertiary) trends within these patterns will offer near-term setups to trade against the primary trend.
KEY TAKEAWAYS ON MULIT-TIMEFRAME ANALYSIS
Some important aspects to keep in mind when utilizing multi-timeframe analysis
- Too many time frames render useless – Some fall into the pitfall of trying to time entry/exit when all the time frames line up with a signal- but this will rarely happen.
- When scaling down in time-frames, utilize a ratio of 1:4 to 1:6 between the trigger and the trend timeframes. For example, if you are taking a trade off the four-hour chart, look for the daily chart for trend analysis. If you are looking for a trade off the one-hour- look at the four-hour for trend analysis.
- Recognize when you’re counter-trend trading – Often times the near-term picture will offer setups against the primary trend like the EURAUD example above. It’s important to approach these trades with more caution, meaning lower leverage and more conservative stops.
Multi-timeframe analysis allows traders to focus on the appropriate timing of trades as well as help identify when trends may be reaching exhaustion. In the example above, if the EURAUD had stayed within the confines of the near-term descending channel formation, no attempts would have been made on the long-side. With the same respect, had we not viewed the trade within the context of the broader trend highlighted on the daily chart, we may have missed the turn all together. Keeping that in mind, always trade within the context of the primary trend and look for near-term price action to offer triggers in time and price.
By Michael Boutros, Strategist, 5th November 2021. DailyFX


0 Comments
Recommended Comments
There are no comments to display.
Create an account or sign in to comment
You need to be a member in order to leave a comment
Create an account
Sign up for a new account in our community. It's easy!
Register a new accountSign in
Already have an account? Sign in here.
Sign In Now