Soft commodities expected to continue rally as fertiliser prices surge

Entry posted by MongiIG in Market News
1,243 views
Fertiliser price surge brings expectations of further strength across soft commodities.
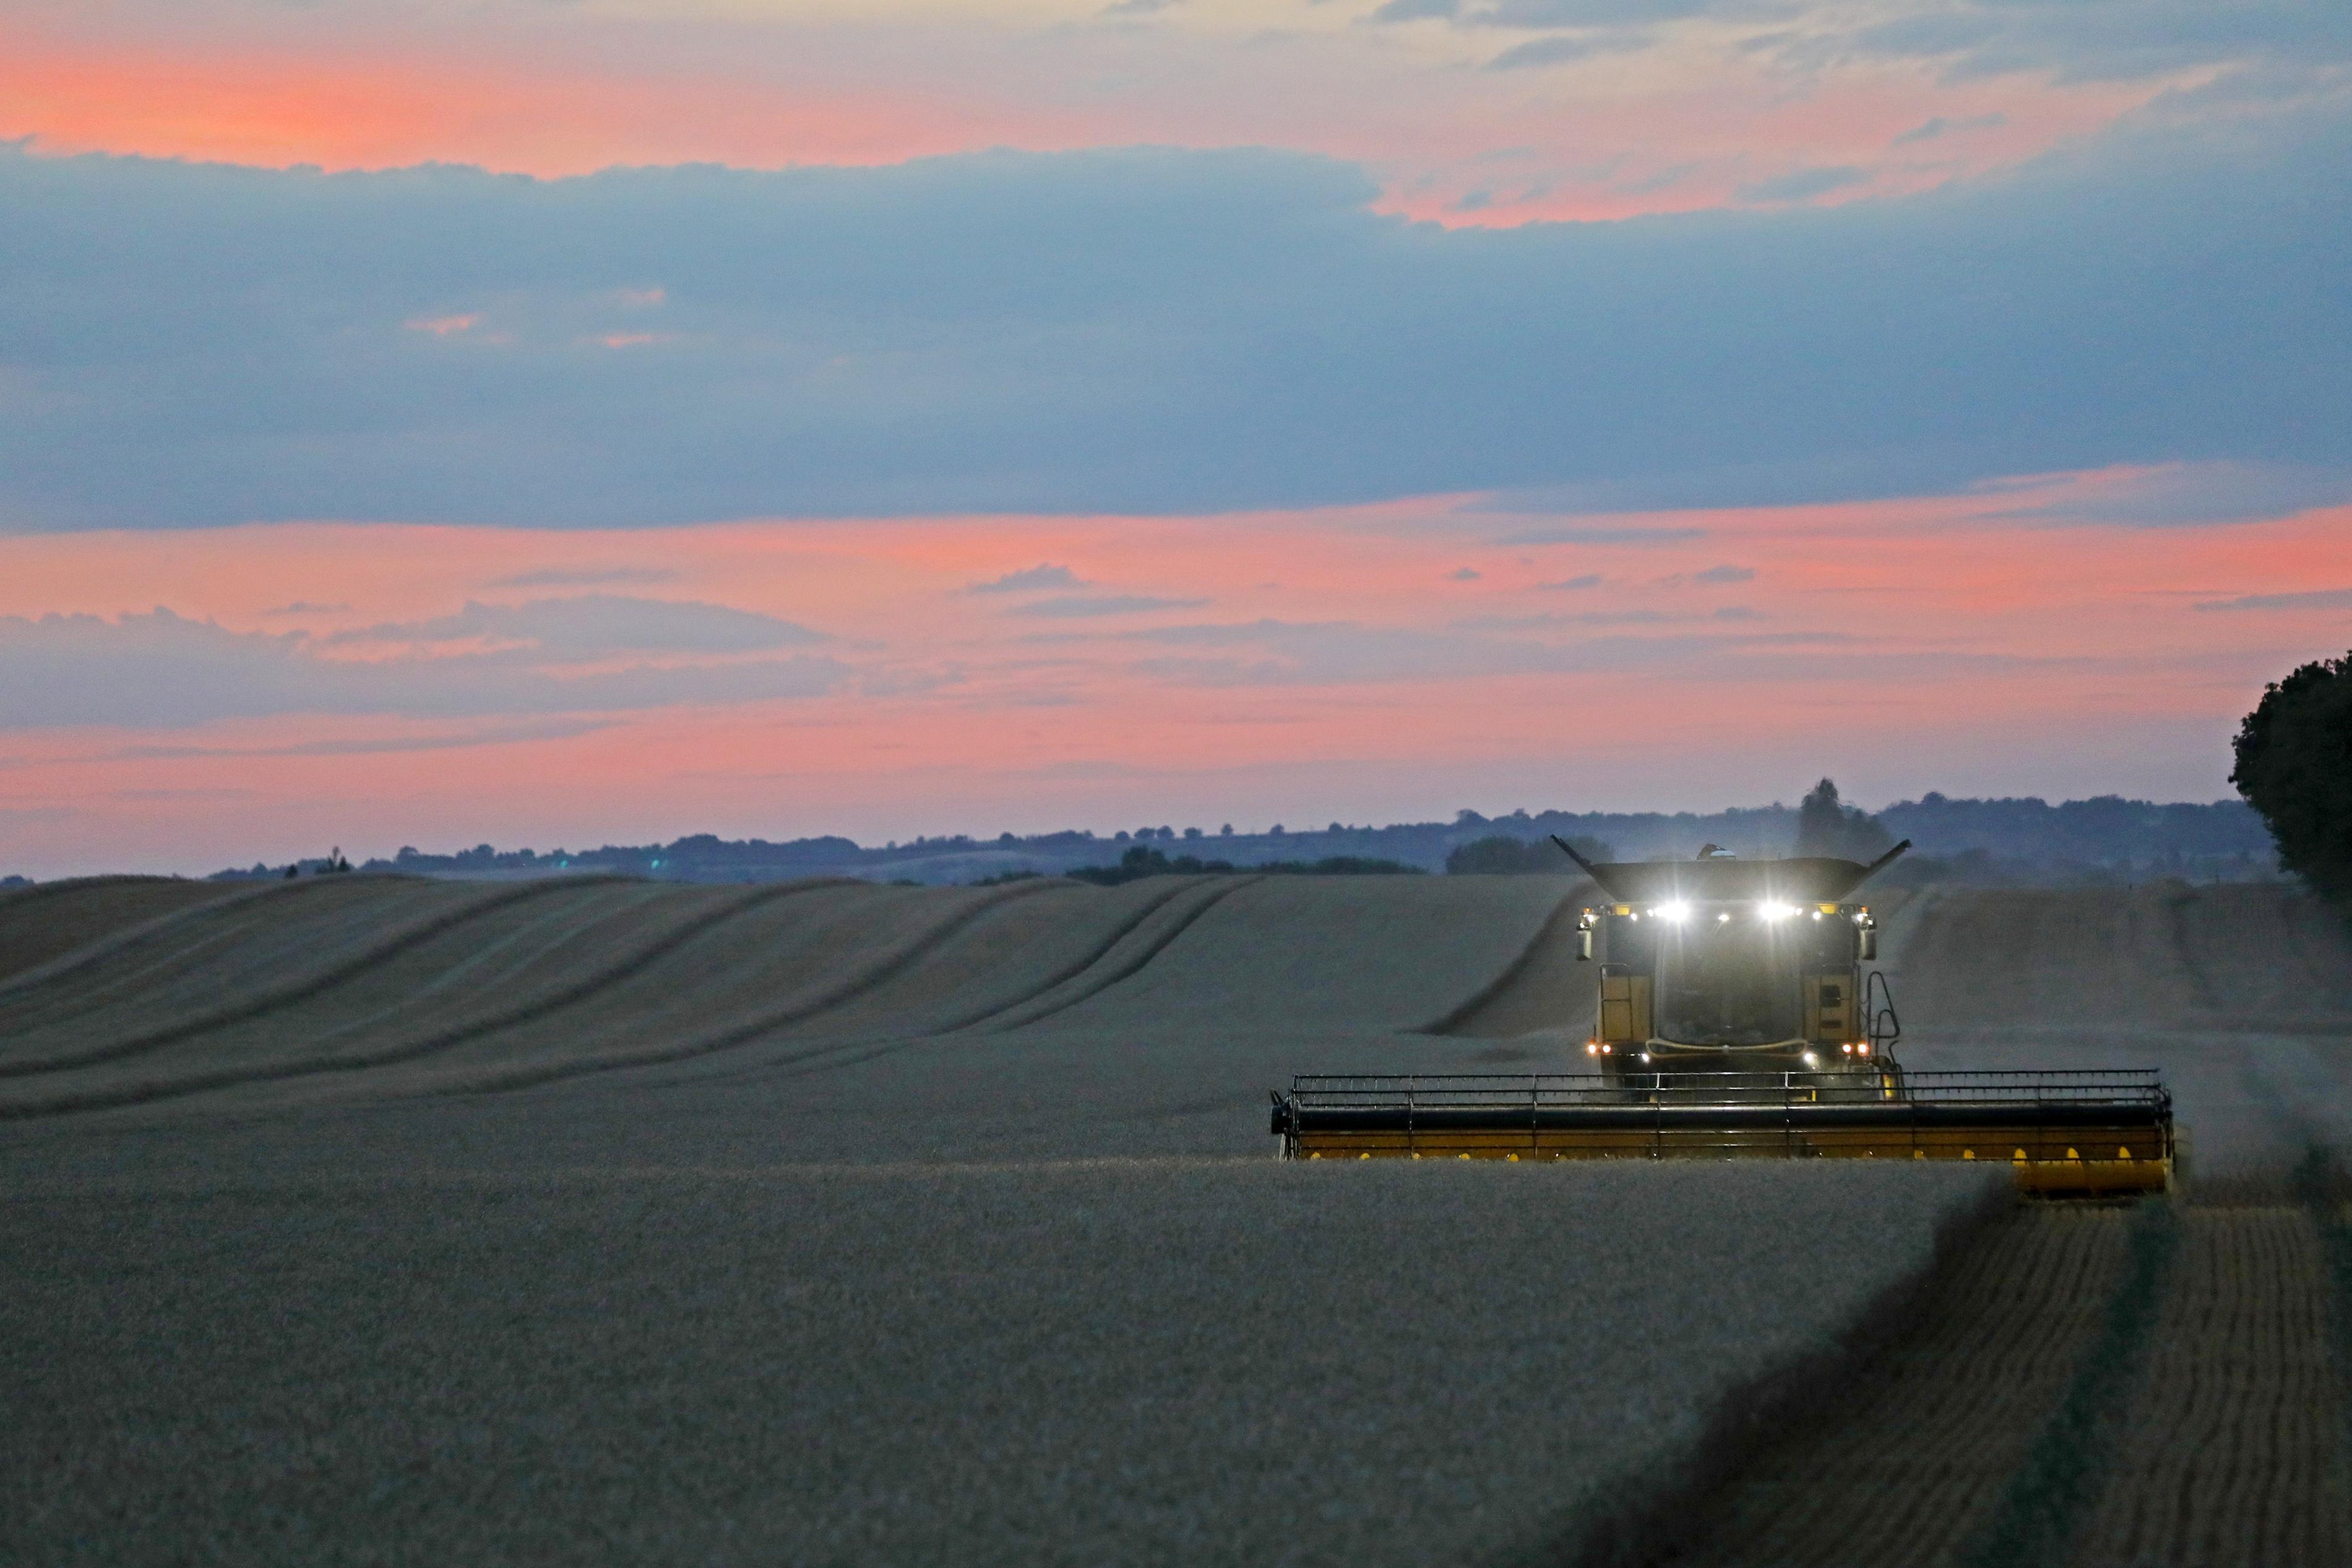 Source: Bloomberg
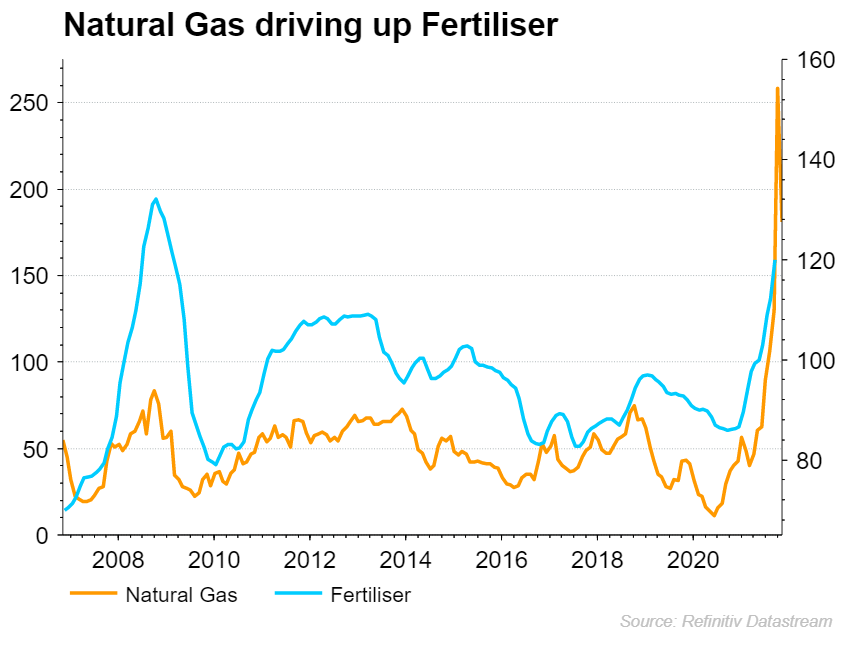
Natural gas surge brings jump in fertiliser costs
Natural gas prices have been one of the big commodity stories of the past year, with rocketing energy costs putting a number of energy companies out of business.
While the rising energy costs could dampen the outlook for consumer spending, it is the impact on fertiliser prices that provide an additional concern for many. Natural gas is a key ingredient for making nitrogen-based fertilisers, with ammonia, urea and nitrates all being impacted.
The chart below highlights the close relationship between the two, with a rapid rise is gas driving up fertiliser prices. Unfortunately there is a risk that gas prices remain elevated, meaning that farmers are faced with the decision of decimating profits by using fertiliser or simply going without.
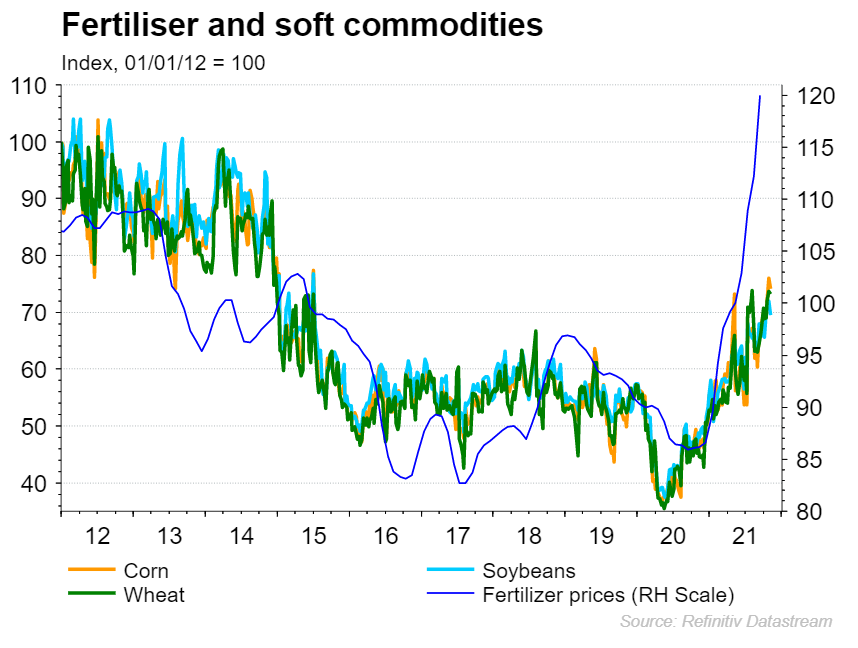
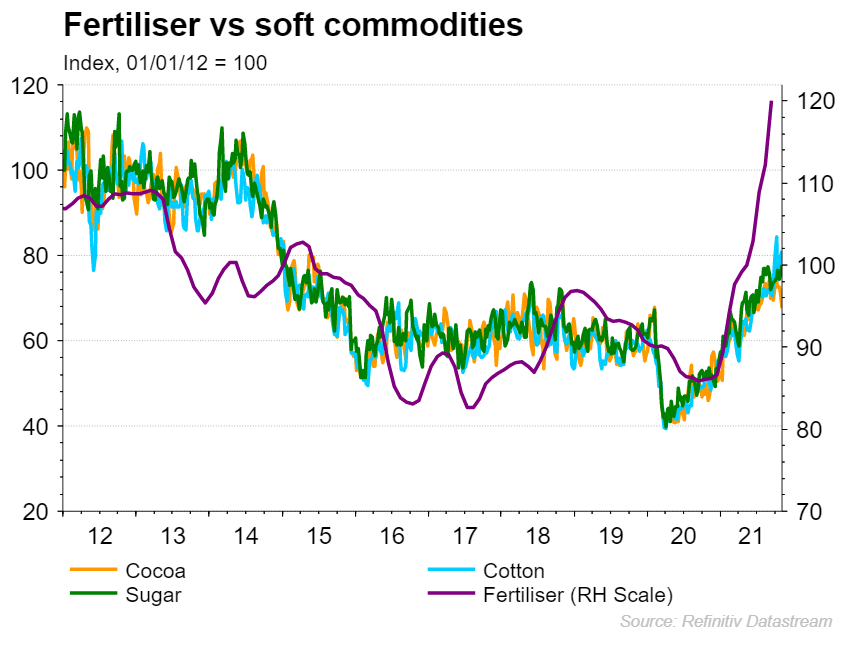
Fertiliser rally could bring soft commodity inflation
With fertiliser prices having rapidly increased in cost over the course of the past year, we are seeing risks that supply may not be as bountiful going forward.
The potential repercussions from such a rapid increase in costs range from lower yielding crops, failed crops, or farmers opting to shift production towards less fertiliser-intensive products. Whether a weaker supply picture drives up prices or we simply see producers shift all the costs on to consumers, it does look likely we will see further upside for soft commodities.
The rise in fuel prices adds another element to that same story. Below we can see the correlation between fertiliser prices and that of corn, wheat, and soybeans. The ramp-up in underlying costs should thus provide the basis for strength in these markets as a result.
Taking corn as an example here, we can see that price has been drifting lower since the peak seen on 2 November.
The recent rise up through $5.51 points towards a potential bottom in the offing, with the rise into $5.93 further highlighting the end of the downtrend seen since the May high. While price has weakened over the course of the past week, this looks to be a buying opportunity.
As such, another bullish turnaround looks likely unless we see a break back below the $5.11 October low.
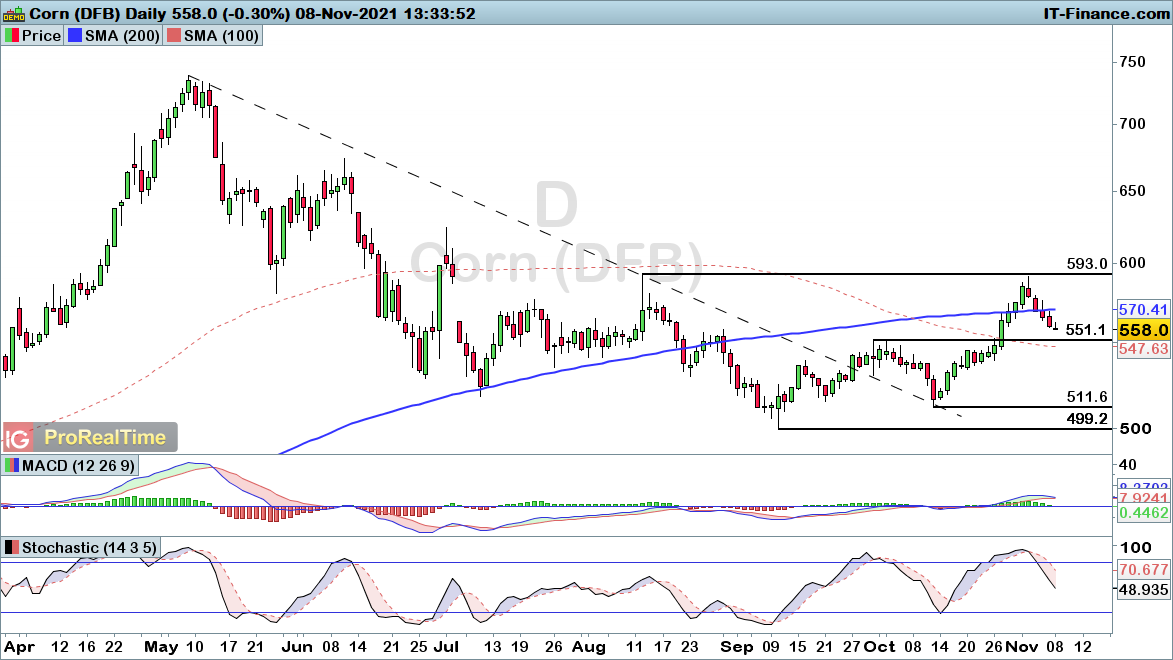 Source: ProRealTime
Another three markets that should enjoy further upside thanks to rising costs come from the likes of cocoa, sugar, and cotton.
The chart highlights a very similar path to those markets seen above, signalling the potential for strength in the coming months.
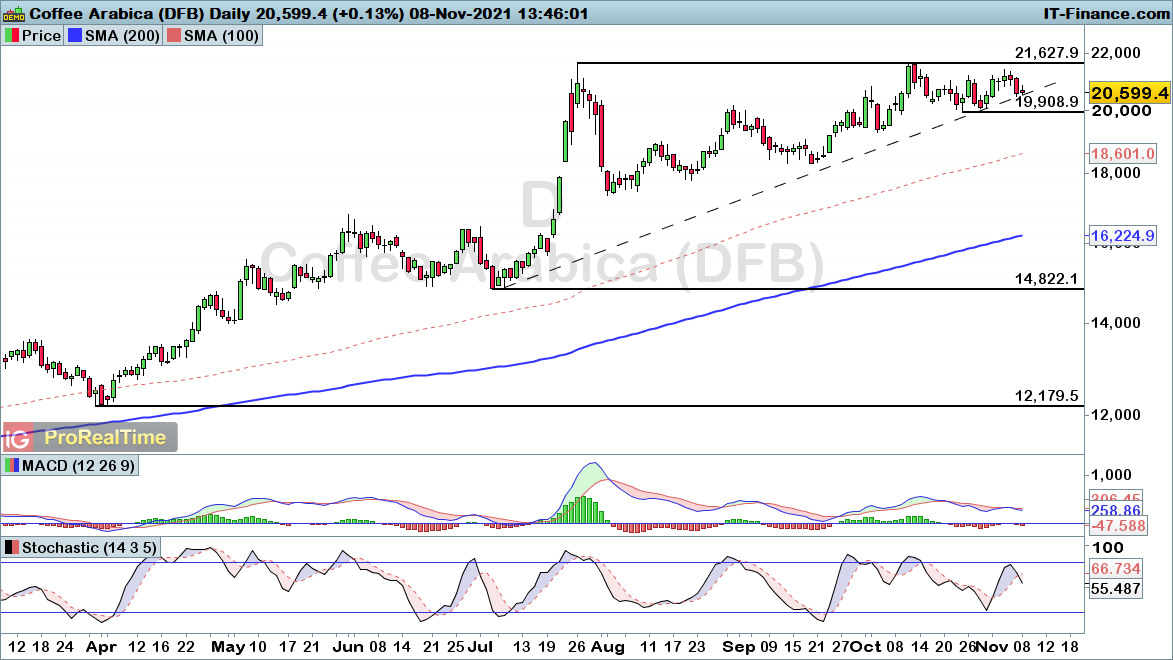
Looking at Arabica coffee prices, we are seeing a shift towards the apex of an ascending triangle formation. The uptrend remains intact, with further gains likely as a result.
A break through the $1.9908 support level brings a more pessimistic near-term view. However, until that level breaks, this recent pullback looks a buying opportunity for Arabica coffee.
 Source: ProRealTime


0 Comments
Recommended Comments
There are no comments to display.
Create an account or sign in to comment
You need to be a member in order to leave a comment
Create an account
Sign up for a new account in our community. It's easy!
Register a new accountSign in
Already have an account? Sign in here.
Sign In Now