Jump to content

Lockdown fears hit IAG shares


MongiIG

1,855 views

IAG has given up much of its post-lockdown share price gain, and with the prospect of tighter restrictions worrying investors the shares continue to struggle.

bg%20IAG%20british%20airways%2064987282.Source: Bloomberg
 Chris Beauchamp | Chief Market Analyst, London | Publication date: Monday 22 November 2021

The news that Austria is re-implementing a lockdown, along with tighter restrictions in Germany and rising cases across Europe, has resulted in further losses for airlines, and IAG is one of those hard-hit.

The shares certainly fell into the ‘reopening winner’ category, rising an impressive 150% from the end of October 2020 until early March, when they hit a peak of 222p. This proved to be the high water mark for the year, and since then a sense of disappointment has crept in. 

It would not be the only stock in this category. The FTSE 100, and the global stock market generally, is full of companies that rallied too far, too fast into the first quarter (Q1) of 2021, and then have struggled to meet these heightened expectations. For IAG the situation in Europe and the (only-recently lifted) bans on travel to the US have been the major worry.

Rising oil costs and higher interest rates have not helped either; while the surge in oil did come from the extreme lows of a year ago, and prices have cooled in October and November, we are still a long way from a complete turnaround in this rally.

While central banks are still some way off from actually hiking rates, some front-running in the market has put pressure on companies with high debt levels, and IAG’s €12.4 billion in net debt is one thing to watch.

IAG shares – technical analysis

Lower highs in October and November do not bode well for the share price, while a drop below rising trendline support from the September low added to the bearish view.

Investors will now be watching whether the price will go back to the key 135p support area, which provided a buying area in December 2020 and January 2021.
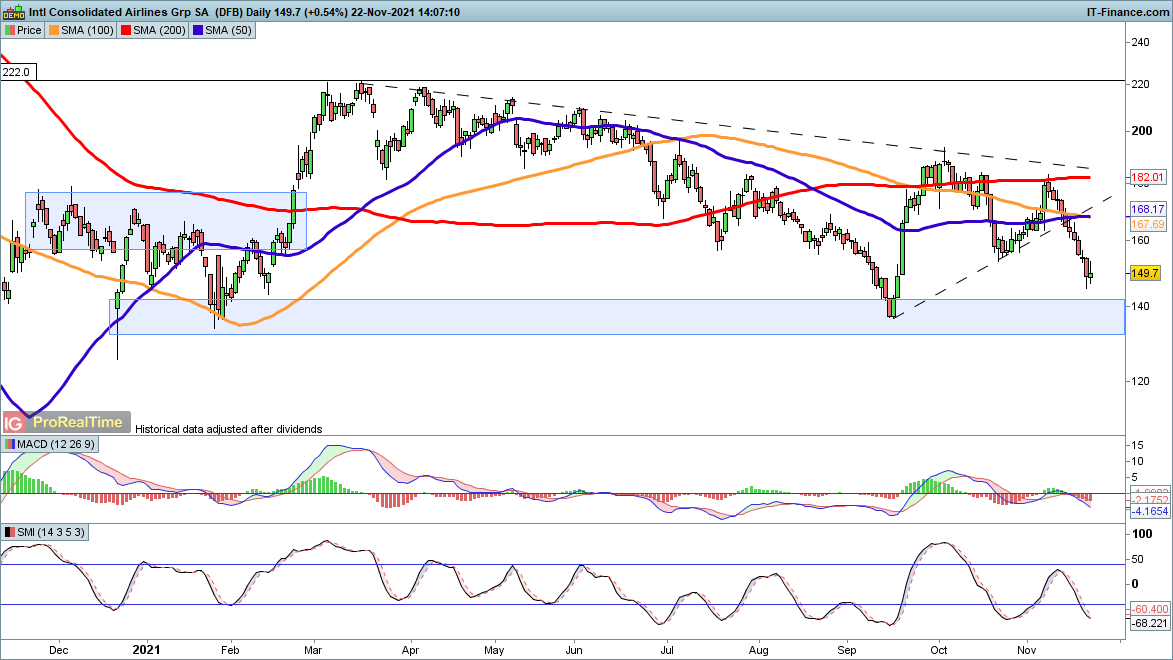
IAG_221121.pngSource: ProRealTime


0 Comments


Recommended Comments

There are no comments to display.

Create an account or sign in to comment

You need to be a member in order to leave a comment

Create an account

Sign up for a new account in our community. It's easy!

Register a new account

Sign in

Already have an account? Sign in here.

Sign In Now
  • Blog Statistics

    • Total Blogs
      3
    • Total Entries
      2,822
  • Latest Forum Topics

  • Our picks

    • International Workers' Day & Early May Trading Hours
      Please be advised that our opening hours will be adjusted on 1 May 2024 for International Workers’ Day and 6 May 2024 for the UK Early May Bank Holiday. Where appropriate, the times listed are in GMT.
        • Like
    • Are these the best AI stocks to watch in May 2024?
      Microsoft, Apple, Nvidia, Amazon and Meta could be the best AI stocks to watch next month. These stocks are the largest AI stocks in the US based on market capitalisation.
    • Natural Gas Commodity Elliottwave Technical Analysis
      Natural Gas


      Mode - Impulsive 


      Structure - Impulse Wave 


      Position - Wave (iii) of 5


      Direction - Wave (iii) of 5 still in play


      Details:  Price now in wave iii as it attempts to breach 1.65 wave i low. Wave (iii) is still expected to extend lower in an impulse.


      Natural Gas is currently breaching the previous April low, marking a decisive move as the impulse initiated on 5th March continues its downward trajectory, further extending the overarching impulse wave sequence that commenced back in August 2022. This decline is anticipated to persist as long as the price remains below the critical resistance level of 2.012.


      Zooming in on the daily chart, we observe the medium-term impulse wave originating from August 2022, which is persisting in its downward trend after completing its 4th wave - delineated as primary wave 4 in blue (circled) - at 3.666 in October 2023. Presently, the 5th wave, identified as primary blue wave 5, is underway, manifesting as an impulse at the intermediate degree in red. It is envisaged that the price will breach the February 2024 low of 1.533 as wave 5 of (3) seeks culmination before an anticipated rebound in wave (4). This confluence of price movements underscores the bearish sentiment prevailing over Natural Gas in the medium term.


      Analyzing the H4 chart, we initiated the impulse wave count for wave (3) from the level of 2.012, which marks the termination point of wave 4. Notably, price action formed a 1-2-1-2 structure, with confirmation established at 1.65 and invalidation set at 2.012. The confirmation of our anticipated direction materialized as price breached the 1.65 mark, signifying a resumption of bearish momentum. Presently, there appears to be minimal resistance hindering the bears, thereby reinstating their dominance in the market. It is projected that wave iii of (iii) of 5 will manifest around 1.43, indicative of the potential for the wave 5 low to extend to 1.3 or even lower. This comprehensive analysis underscores the prevailing bearish outlook for Natural Gas in the immediate future.


      Technical Analyst : Sanmi Adeagbo
       
        • Like
×
×
  • Create New...
us