Dollar firm as US data and FOMC minutes point to earlier rate hike

Entry posted by MongiIG in Market News
2,117 views
In this article we review hawkish FOMC meeting minutes and stronger US data and assess where the dollar could be heading next.
 Source: Bloomberg
This week’s US data all seems to suggest that interest rates in the world's largest economy are likely to rise sooner than initially expected.
Federal reserve continuity
News that Jerome Powell has been re-nominated by President Joe Biden for the Federal Chairperson position, has kicked off gains in the dollar this week. These gains have then been furthered following US inflation and employment data, as well as Federal Open Market Committee (FOMC) meeting minutes.
Labour improves while inflation soars
Weekly US jobs data has seen claims moving to their lowest levels in more than 50 years. Core PCE (Personal Consumption Expediture) was reported as having risen by 4.1% year-on-year, a level last seen in February 1991.
FOMC minutes reveal a more hawkish Fed
The FOMC meeting minutes allude to a more hawkish Federal Reserve (Fed).
Various members of the central bank have suggested raising the target range for the Federal Funds Rate sooner (than previously guided). The last Federal Dot Plot released in September by the bank suggested an initial hike in rates by early 2023, although Fed Fund Futures have implied that the next rate hike is more likely be in June 2022, with a 30% probability of a rate hike in March 2022.
Since the FOMC meeting, inflation has continued to track at multi-decade highs, while the labour market has steadily been improving. This feeds into the Fed’s mandate of price stability and maximum employment. The meeting minutes do suggest that the Fed are now most likely to raise lending rates in June 2022. If elevated energy prices and supply chain disruptions (major inflation drivers) don’t abate, then the probability of a hike in March 2022 is likely to increase further.
As a result of this week’s news we have seen continued strength in the US dollar, while US Treasury Yields have risen within the week, more notably on the shorter dated end to flatten the yield curve somewhat.
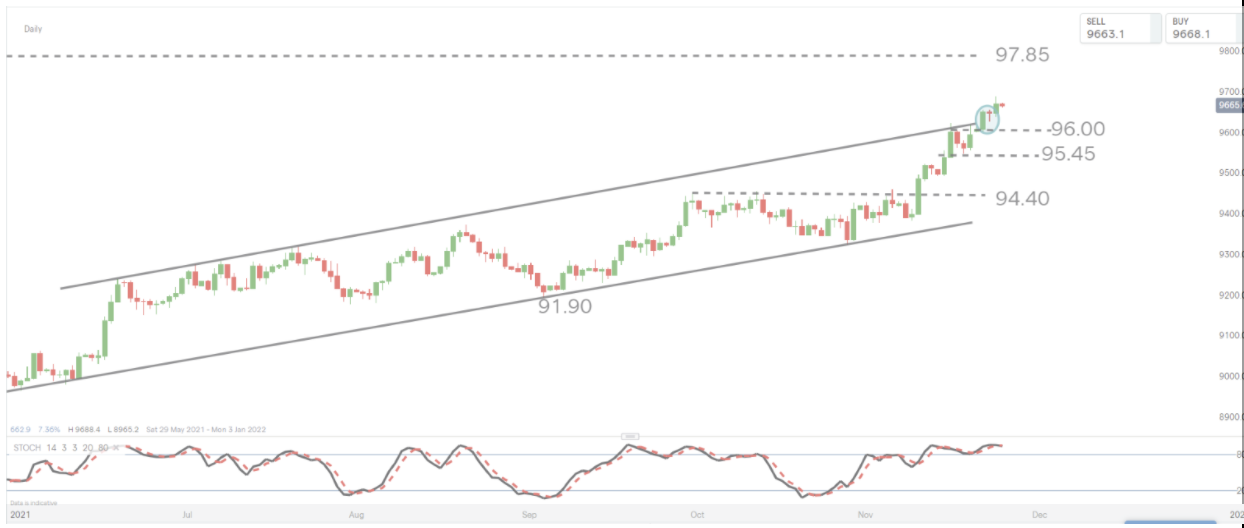
The Dollar Index: technical view
 Source: ProRealTime
Circled blue we see that the US Dollar Index (DXY) has broken above channel resistance. This move highlights an accelerating upward trend with historical resistance at 97.85 a further upside target from the move.
However, the move higher has moved the DXY into overbought territory. This is not a suggestion to trade against the prevailing uptrend, but simply that we could see either a sideways consolidation or near-term correction before further gains.
In the event of a pullback, traders looking for long entry might hope for a bullish reversal at one of the support levels labelled on our chart, using a close below the reversal low as a stop-loss indication for the trade.


0 Comments
Recommended Comments
There are no comments to display.
Create an account or sign in to comment
You need to be a member in order to leave a comment
Create an account
Sign up for a new account in our community. It's easy!
Register a new accountSign in
Already have an account? Sign in here.
Sign In Now