S&P 500 Stages Reversal, Dollar Volatility After Powell, Dow the Worrying Signal

Entry posted by MongiIG in Market News
721 views
S&P 500, NASDAQ 100, DOW, COVID AND DOLLAR TALKING POINTS:
- The S&P 500 has carved out an aggressive head-and-shoulders reversal pattern, but is this artificially shaped by month-end activity?
- Fed Chairman Powell is warning the markets that the FOMC may very well accelerate its tightening time table in two weeks.
- As we wade through capital flows, monetary policy speculation and growth updates; I remain concerned about the ‘signal’ from the Dow.
/GettyImages-496030068-29ec863cca36413ab111277d250fe964.jpg)
RISK AVERSION: SEPARATING THE NOISE FROM THE SIGNAL
Tuesday closed out the month of November, and the picture was not an encouraging one on the higher time frame – unless you were looking to the Nasdaq 100. Across the ‘risk’ board, measures of speculative appetite were leaning into varying degrees of loss. For many measures like global equities, emerging markets, junk bonds and carry trade; we have seen the a slide unfold for some time. However, there was a particular acceleration witness through this past session. The set up was particularly noticeable for the S&P 500, my preferred benchmark for biased risk appetite. The broad index notched another -1.9 percent loss which carries more weight in my eyes than Friday’s steeper tumble given the volume that was behind the move. That said, month-end market actions like position rollover and unwinding for tax purposes can temporarily distort the speculative backdrop and absolutely spur greater turnover. Follow through on this front is not as clear cut as the head-and-shoulders pattern that the index insinuates. That said, if we break 4,550; I will consider it meaningful technical traction.
Chart of S&P 500 with Volume and Volume (Daily)
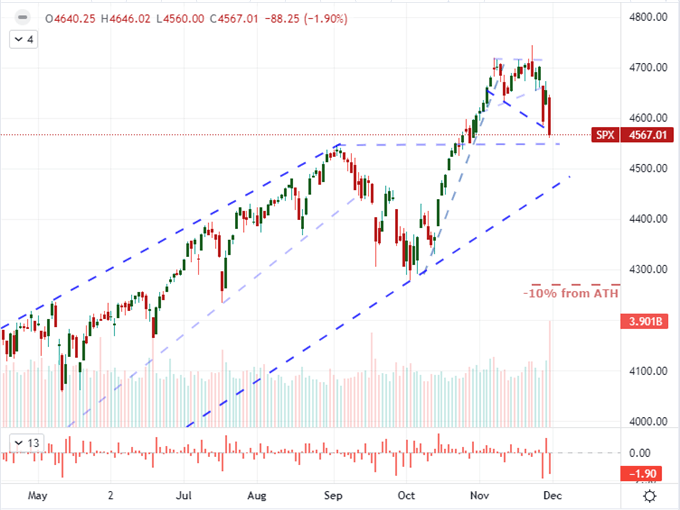
Chart Created on Tradingview Platform
From the S&P 500, we may be seeing a mix of ‘noise’ to an underlying signal. I believe it is important that so many risk-sensitive assets have been eroding for weeks such that hold out may simply be folding under the pressure. That said, the resiliency of the ‘buy the dip’ mentality (or its cousin, complacency) is so persistent that calling the bull dead is too ambitious. If there is a rebound in the monthly opening capital distribution or should there be a favorable interpretation of the Omicron’s virulency, it is more than possible that the SPX sees a bounce. That said, I think the prevailing winds around the Dow are more informative of the steering current. Individually, the index has dropped markedly over the past few weeks; while the disparity to the tech-heavy Nasdaq 100 is starting to offer a very apparent speculative stretch. The Nasdaq-to-Dow ratio tagged its March 2000 ‘Dot-Com’ bubble high this past session. While many investors are unaware of the historical context, there is broader recognition that these markets are seriously top heavy.
Chart of Nasdaq to Dow Ratio Overlaid with the Dow Jones Industrial Average (Daily)
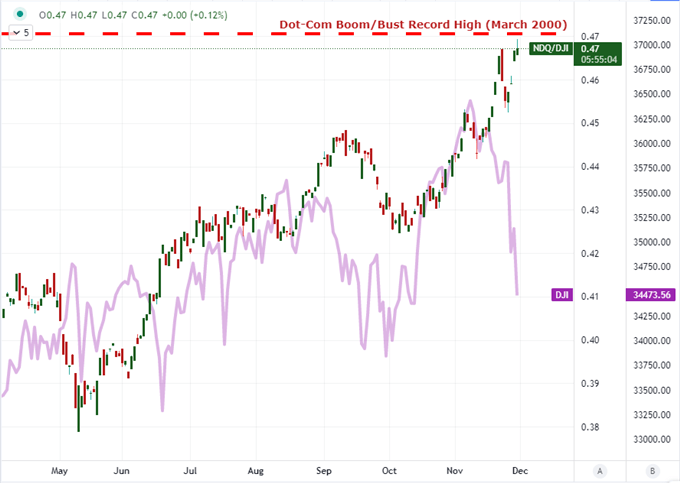
Chart Created on Tradingview Platform
TRANSITIONING FROM NOVEMBER TO DECEMBER
Just like the volume charge that we see in derivatives around options expiration (particularly the so-called triple witching or quad witching hour), the transition from one month into the next carries with it necessary ‘roll’ for certain large market participants that need to square their books and reprice. We certainly saw the impact in the turnover from the benchmarks this session – though the risk backdrop no doubt played a role in the S&P 500’s heaviest volume day in 8 months. If the majority of the market volatility and turnover was a byproduct of the short-term seasonal influence, it is reasonable to expect stabilization or even an outright rebound into Wednesday. Looking at the bigger picture of seasonality, the 48th week of the year historically is a positive one for the benchmark index; and the month of December is known for meaningful gains for the SPX – though so was November. I believe it is a good time to be skeptical of the habitual at the moment. The probabilities may still skew, but the risk/reward with falling back on such norms is too skewed to give in to such complacency.
Chart of S&P 500 Monthly Performance, Volume and Volatility
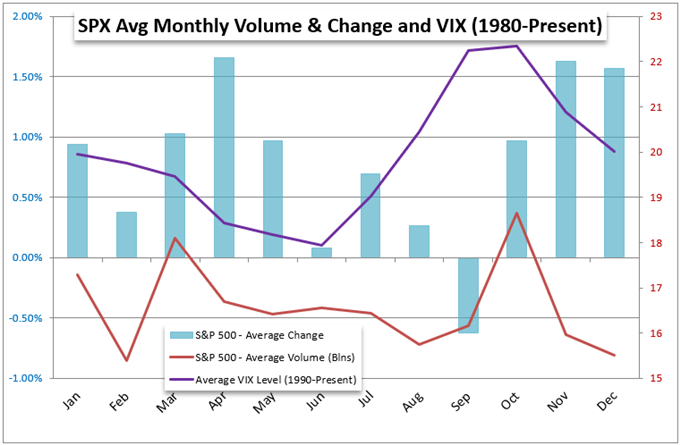
Chart Created on John Kicklighter with Data from S&P
THE TOP FUNDAMENTAL THEME AND TOP EVENT RISK
As we head into Wednesday trade, there are a few competing underlying themes that will be fighting for control of the investors’ convictions. The density of Omicron mentions this past session noticeably eased, but that does not make its risk to global health and pending threat to economic strength any less substantial. If the markets are looking for a reason to de-risk, this is a very tangible concern. Otherwise, if the collective is willing to maintain its complacent blinders; the breakthrough is not likely to come until there is a clearer transition of impacting the economy and/or financial system through lockdowns or trade curbs. Meanwhile, monetary policy is proving an unexpectedly productive matter. This past session, in his testimony to Congress, Fed Chairman Jerome Powell made the concerted effort to signal that it was time to drop the ‘transitory’ descriptor when referring to inflation and that the policy group will discuss accelerating its taper timeline in two weeks. This reads as the most strategic option for Powell who could simply ignore signaling and may be forced to surprise on December 15th – or worse yet, when they suddenly accelerate the taper next year. The Dollar has seen the fruits of this shift but rate forecasts in Yields and Fed Fund futures have not fully recovered.
Chart of DXY Dollar Index with 1-Day Rate of Change Overlaid with Fed 2022 Implied Hikes (Daily)
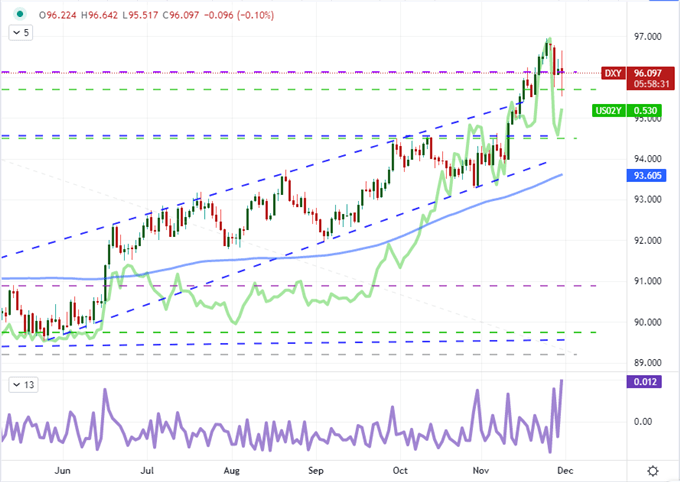
Chart Created on Tradingview Platform
From theme to event risk, the docket will shift from Eurozone inflation, Fed testimony and a few emerging market highlights to a more consistent focus on growth via manufacturing activity reports. Australia’s 3Q GDP update was a direct read; but there is also a run of factory activity data that will give a thematic view of economic health. China, India, Turkey and South Africa are due to report PMIs for November this morning. Meanwhile, in the Americas, the United States (ISM), Canada, Mexico and Brazil will issue their own manufacturing reports. While not the largest source of growth for all of this countries – services are much larger for the US for example – there is a more distinct connection to supply chains in factory health.
Calendar of Major Macro Event Risk Through Week End
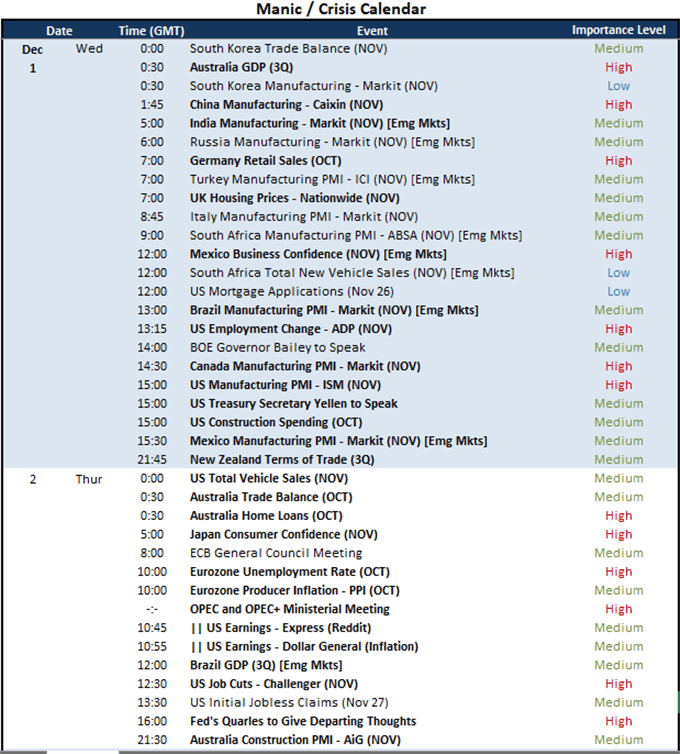
Calendar Created by John Kicklighter
By John Kicklighter, Chief Strategist, 1st December 2021. DailyFX


0 Comments
Recommended Comments
There are no comments to display.
Create an account or sign in to comment
You need to be a member in order to leave a comment
Create an account
Sign up for a new account in our community. It's easy!
Register a new accountSign in
Already have an account? Sign in here.
Sign In Now