Crude Oil Overview: OPEC+ Agrees on Output Increase, Oil’s Sharp sell-off Analyzed

Entry posted by MongiIG in Market News
1,588 views
BRENT CRUDE OIL AFTER OPEC+ MEETING:
- Brent crude oil’s sharp sell-off and recovery after OPEC+ stick with January plan but reserve the right to alter the decision.
- Oil recovers from sharp sell-off as key long-term trendline remains intact.
- IG Client Sentiment ‘mixed’ once more despite even larger net long positioning than previously.

OPEC+ LEAVES JANUARY OUTPUT PLANS UNCHANGED BUT REMAINS FLEXIBLE TO OMICRON-RELATED SHOCKS
Yesterday the Organization of Petroleum Exporting Countries (OPEC), Russia and its allies, known as ‘OPEC+’, decided to stick to its original plan to increase oil supply by 400,000 barrels per day (bpd) despite the ongoing threat of Omicron on travel restrictions and the coordinated release of special petroleum reserves (SPR) by the US and others.
As a result, oil prices dropped sharply as the news filtered through to the markets with oil trading down 4% at one stage and trading well below $66. The sharp drop has appeared to be overdone as crude oil recovered to end the day in the green. Today, in early London session Oil continues where it let off yesterday as it trades slightly higher at around $71.40.
OPEC’s decision has been welcomed by the US after countless calls for the group to alleviate rising energy costs in light of rising inflation among developed nations. However, OPEC + remains flexible to the unknown effects of the Omicron variant as far as it relates to travel restrictions and ultimately the demand for oil, by keeping the meeting “in session”, allowing any changes in the lead up to January 2022.
BRENT CRUDE OIL TECHNICAL ANALYSIS
In an attempt to view yesterday’s move in the wider context, we start by viewing the weekly chart where the sharp drop in prices is clearly visible by the long lower wick which broke below the long term trendline momentarily. A successful hold above the trendline this week would suggest a continuation of the longer term bullish move however the situation remains rather uncertain and depends on scientific findings on the Omicron variant, meaning pockets of volatility may still be observed in the coming days.
Brent Crude Oil Weekly Chart Showing LT Trend Intact
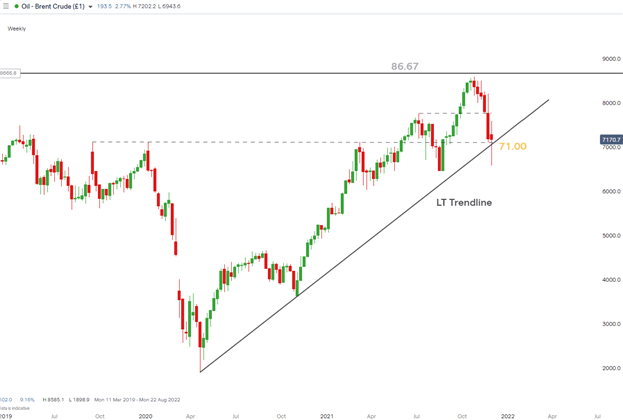
Chart prepared by Richard Snow, IG
The daily charts reveals shorter term levels to keep a watchful eye on including: 67.45, 71.00 and 72.65. Although yesterday’s decline traded below 67.45, prior support was found at this level and remains a key indicator when assessing the probability of a sustained move lower. However, the resilience of the oil market and crucial hold (thus far) above the long term trendline favors a test of the 72.65 level but with such uncertainty and the lack of surprise Omicron-related data, we may see oil consolidating around 70-72.65.
Brent Crude Oil Daily Chart
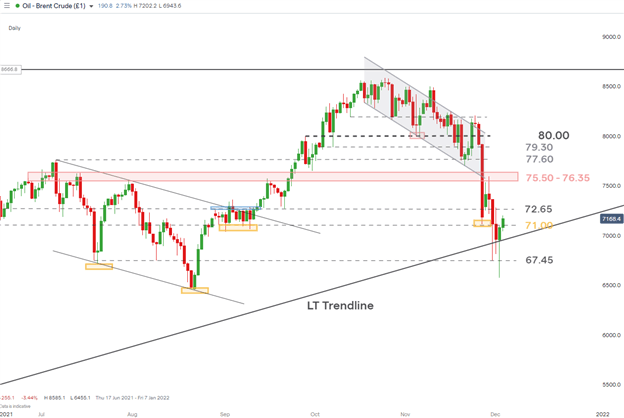
Chart prepared by Richard Snow, IG
IG CLIENT SENTIMENT ‘MIXED’ DESPITE EVEN GREATER LONG POSITIONING
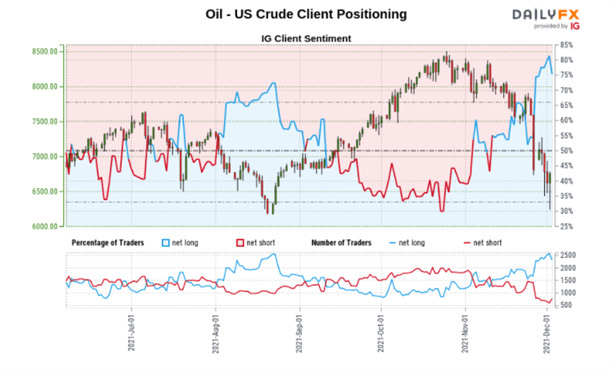
Oil - US Crude: Retail trader data shows 74.17% of traders are net-long with the ratio of traders long to short at 2.87 to 1.
We typically take a contrarian view to crowd sentiment, and the fact traders are net-long suggests Oil - US Crude prices may continue to fall.
The number of traders net-long is 11.61% lower than yesterday and 36.29% higher from last week, while the number of traders net-short is 19.67% higher than yesterday and 40.21% lower from last week.
Positioning is less net-long than yesterday but more net-long from last week. The combination of current sentiment and recent changes gives us a further mixed Oil - US Crude trading bias.
Written by Richard Snow, Analyst, 3rd December 2021. DailyFX


.jpeg.98f0cfe51803b4af23bc6b06b29ba6ff.jpeg)


0 Comments
Recommended Comments
There are no comments to display.
Create an account or sign in to comment
You need to be a member in order to leave a comment
Create an account
Sign up for a new account in our community. It's easy!
Register a new accountSign in
Already have an account? Sign in here.
Sign In Now