3 Trading Exit Strategies – How to Exit a Profitable Trade

Entry posted by MongiIG in Analyst piece
1,582 views

- Reviewed by James Stanley, Nov. 24, 2021
TRADING EXIT STRATEGIES THAT ARE EFFECTIVE:
- Traditional stop/limit (using support and resistance)
- Moving average trailing stops
- Volatility based approach using ATR
Traders focus a lot of their energy on spotting the perfect time to enter a trade. While this is important, it is ultimately where traders choose to exit trades that will determine how successful the trade is. This article hones in on 3 trading exit strategies that traders should consider when looking to get out of a trade.
FOREX EXIT STRATEGY #1: TRADITIONAL STOP/LIMIT (USING SUPPORT AND RESISTANCE)
One of the best ways to keep emotions in check is to set targets (limits) and stops at the same time the trade is entered into. This is a much better approach than entering without a ‘stop loss’ and having to wipe the perspiration from your brow as you watch losing trades consume the account equity.
Through DailyFX’s research into over 30 million live trades we uncovered that setting a risk to reward ratio of at least 1:1 was one of the common traits of successful traders.
Read the guide below for a summary of the main findings of this research:
Before making the entry into the market, traders should analyze the amount of risk they are willing to assume and set a stop at that level, while placing a target at least that many pips away. If traders are wrong, trades will automatically be closed at an acceptable level of risk; if traders are correct and price hits the target, the trade is also automatically closed. Either outcome provides traders with an exit.
Well-defined support and resistance in USD/JPY
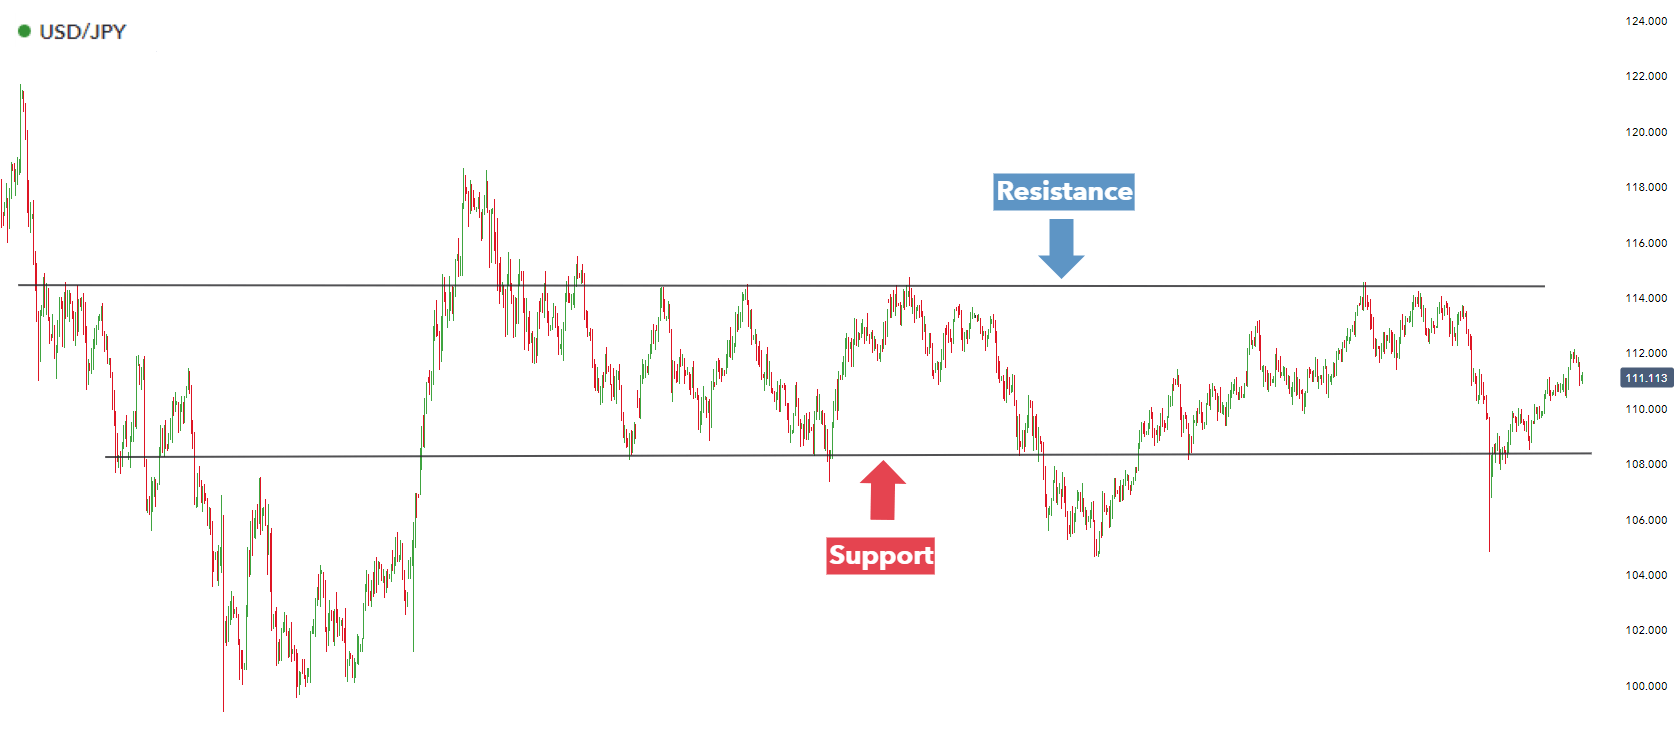
Traders looking to go long would look for price to bounce off support in conjunction with clear buy signals using indicators. Since price has broken lower than support temporarily, traders would look to place a stop slightly below the level of support. The limit can be placed at the level of resistance as price has approached this level multiple times. For short positions, this will be reversed and stops can be placed near resistance with limits placed at support.
FOREX EXIT STRATEGY #2: MOVING AVERAGE TRAILING STOPS
It has long been known that a moving average can be an effective tool to filter what direction a currency pair has trended. The basic idea is that traders look for buying opportunities when the price is above a moving average and look for selling opportunities when the price is below a moving average. However, it can also be useful to consider a moving average as a trailing stop.
The idea is that if a MA crosses over price, then the trend is shifting. Trend traders would want to close out the positions once this shift has occurred. This is why setting your stop loss based on a moving average could be effective.
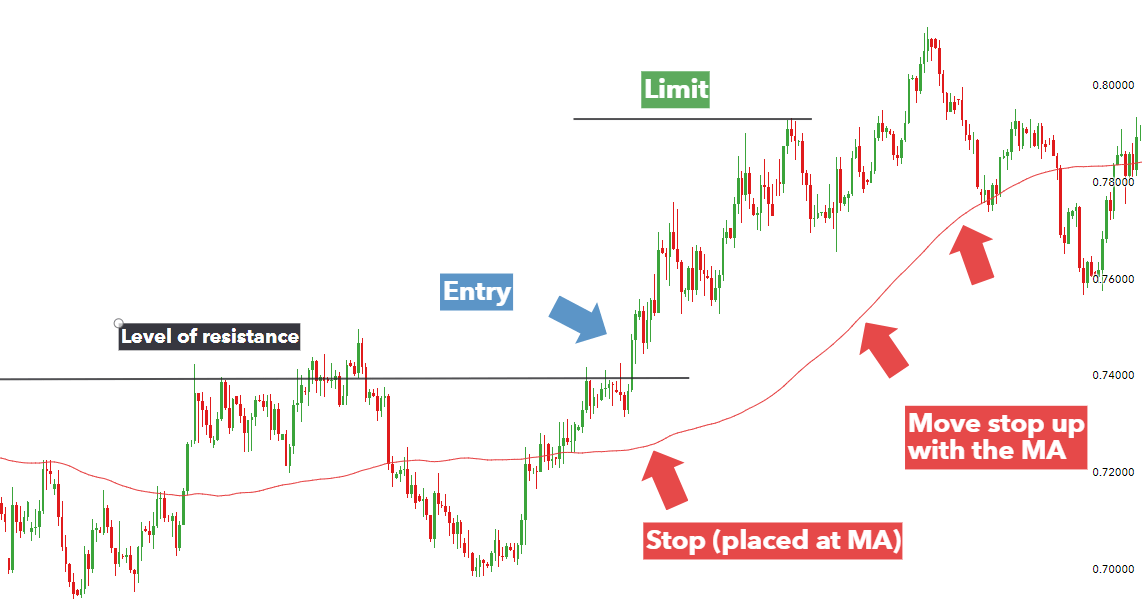
The above chart depicts a long entry above a break of resistance, which is also above the 100 day simple moving average. The stop is places 220 points away at the moving average and the limit is placed 440 points away to ensure a 1:2 risk to reward ratio. As price rises, so will the MA and the stop should be moved to wherever the MA is. This creates a safety net in case price turns sharply.
FOREX EXIT STRATEGY #3: VOLATILITY BASED APPROACH USING (ATR)
This final technique uses the Average True Range (ATR). The ATR is designed to measure market volatility. By taking the average range between the high and the low for the last 14 candles, it tells traders how erratic the market is behaving, and this can be used to set stops and limits for each trade.
The greater the ATR is on a given pair, the wider the stop should be. This makes sense because a tight stop on a volatile pair could get stopped out too early. Also, setting stops that are too wide for a less volatile pair, essentially takes on more risk than is necessary.
The ATR indicator is universal as it can be adapted to any time frame. Simply set your stop slightly above 100% of ATR and set your limit at least the same distance away from the entry point.
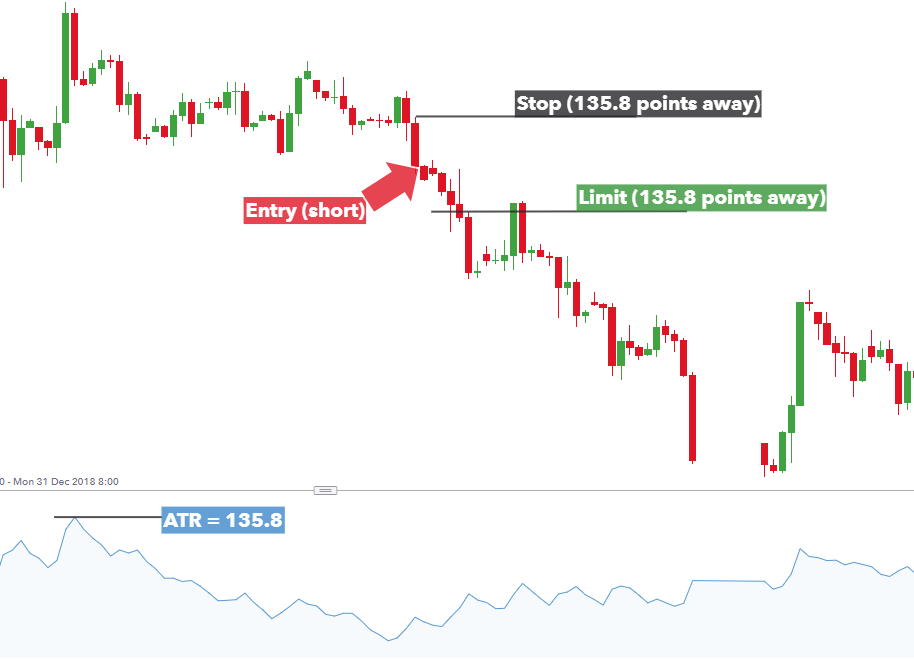
The ATR indicator for Brent Crude oil is shown in blue at the bottom of the chart and shows the highest average volatility experienced peaked at 135.8 pips. Therefore, when a trader places a short trade the stop and limit will be 135.8 pips away from entry, in a 1:1 risk to reward set up. Placing stops around the ATR essentially acts as a volatility stop.
The chart makes it clear that in this case a 1:1 risk to reward ratio closed the trade prematurely. This emphasizes the importance of the risk to reward ratio as traders should be targeting more pips with minimal risk which results in a better risk to reward ratio.
FOREX EXIT STRATEGIES: A SUMMARY
- Remember that forex trading is more than just getting good entries as the success of a trade will ultimately depend on where traders exit their positions.
- New traders can build confidence in trading by having a trading plan that implements a precise exit strategy to close out trades.
- Trading exit strategies are just one part of a complete forex strategy. Find out more about our top forex trading strategies.
By Richard Snow, Analyst, 14th December 2021. DailyFX


0 Comments
Recommended Comments
There are no comments to display.
Create an account or sign in to comment
You need to be a member in order to leave a comment
Create an account
Sign up for a new account in our community. It's easy!
Register a new accountSign in
Already have an account? Sign in here.
Sign In Now