Nasdaq Pullback: Where’s the Santa Claus Rally?

Entry posted by MongiIG in Market News
1,190 views
Nasdaq Pullback
Dec 20, 2021
By: James Blakeway, Tastytrade
Whether you want to blame it on the spread of the Omicron variant and impending global lockdowns or the upcoming slowdown of the Federal Reserve’s asset purchase program, the broad stock indices are taking a turn. Gone are the days of back-to-back, nonstop rallies in the S&P 500, Nasdaq-100 and Russell 2000, for now at least. The S&P and Nasdaq hit all-time highs on November 22nd, while the Russell found its high on the 8th of November. Since then, all three are in rougher shape with the Russell down almost 12% off of the high.
.png)
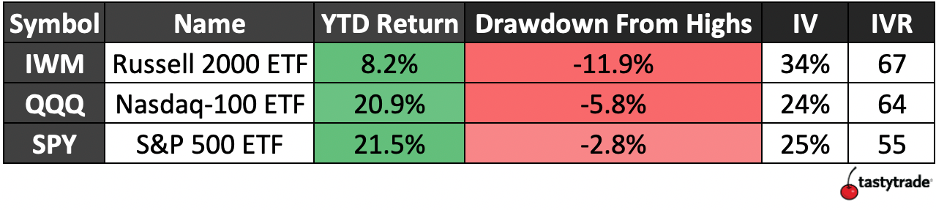
All three index exchange traded funds (ETFs) exhibit high implied volatility rank (IVR) as a direct result of the selling and uncertainty of future movement. Both the Russell 2000 ETF (IWM) and Nasdaq-100 ETF (QQQ) show IVRs in the 60s, compared to the S&P 500 (SPY) with an IVR of 55.
Regardless of directional bias, traders mitigate a portion of risk when trading options on ETFs instead of individual stocks. By providing exposure to a large basket of stocks, the index ETFs reduce susceptibility to large earnings moves, other corporate actions and news driven moves that impact the individual companies.
Top 10 Stocks in IWM & QQQ
Traders looking for the most diverse basket of stocks would likely favor the Russell 2000 and IWM, with the clue being in the name. The ETF holds a basket of 2000 small-cap stocks with no single stock comprising more than 0.5% of the portfolio. In total, the top 10 holdings in IWM make up only 3.3% of the entire portfolio.
.png)
Now contrast this with the Nasdaq and QQQ, where the top 10 stocks make up a staggering 52% of the total holdings.
.png)
Additionally, the sector exposure of the QQQ is extremely tech heavy, at around 49% with an additional 18% in communication services. For IWM, healthcare is the largest sector at 17% with industrials and financials tied for second place at 15% each.
Traders should be mindful that the top tech stocks in the Nasdaq are also the top components of the S&P 500 and both long term portfolios and shorter-term trading accounts can become overly exposed to those stocks very quickly.
Trade Ideas in QQQ ETF
Traders looking to take advantage of some heightened options prices may be interested in trades for QQQ in the February expiration. The Alpha Boost email from Quiet Foundation highlighted some potential trades this morning.
This Jade Lizard idea combines selling a 280 put and a 408/410 call spread for a position with no upside risk at expiration.
.png)
This trade is slightly net bullish in its delta but will make money as long as QQQ stays above $280, $100 below current prices. The overall credit being above $2 creates no risk even if QQQ rallies above $408.
This short call spread idea may be for traders who believe the selloff has room to run for the Nasdaq. Combining the short 400 call and long 405 call this call spread collects 1/3 the width of the strikes and has an upside breakeven of 401.70.
.png)


0 Comments
Recommended Comments
There are no comments to display.
Create an account or sign in to comment
You need to be a member in order to leave a comment
Create an account
Sign up for a new account in our community. It's easy!
Register a new accountSign in
Already have an account? Sign in here.
Sign In Now