The New York Session: Forex Trading Tips

Entry posted by MongiIG in Analyst piece
3,298 views

- Reviewed by James Stanley, Nov. 24, 2021
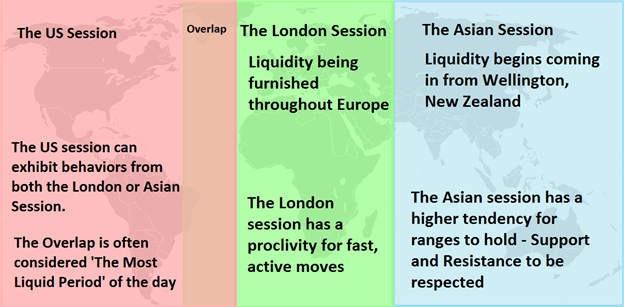
The New York forex session is one of the most liquid forex trading sessions. When the US session overlaps with the London forex market session it is considered to be the most liquid period of the day.
WHAT TIME DOES THE NEW YORK FOREX SESSION OPEN?
The New York forex session opens at 8:00 AM ET and closes at 5:00 PM ET. The ‘overlap’ occurs when the US Forex session overlaps with the London forex market session. The London Forex market session opens at 3:00 AM ET and closes at 12:00 PM ET, so the overlap occurs between 8:00 AM ET and 12:00 PM ET.
During this overlap, the US session could trade very much like the London session.
The beginning of the New York session is normally more volatile than later in the day. There are different methods traders can use to trade differing levels of volatility.
NEW YORK BREAKOUT STRATEGY: TRADING THE ‘OVERLAP’
The ‘overlap’ is when the London and US forex sessions literally overlap each other. These are the two largest market centers in the world, and during this four-hour period – large and fast moves can be seen during the overlap as a large amount of liquidity enters the market.
The image below shows how during the overlap (between the green lines) of the two biggest markets, average hourly moves in the EUR/USD reach highs.
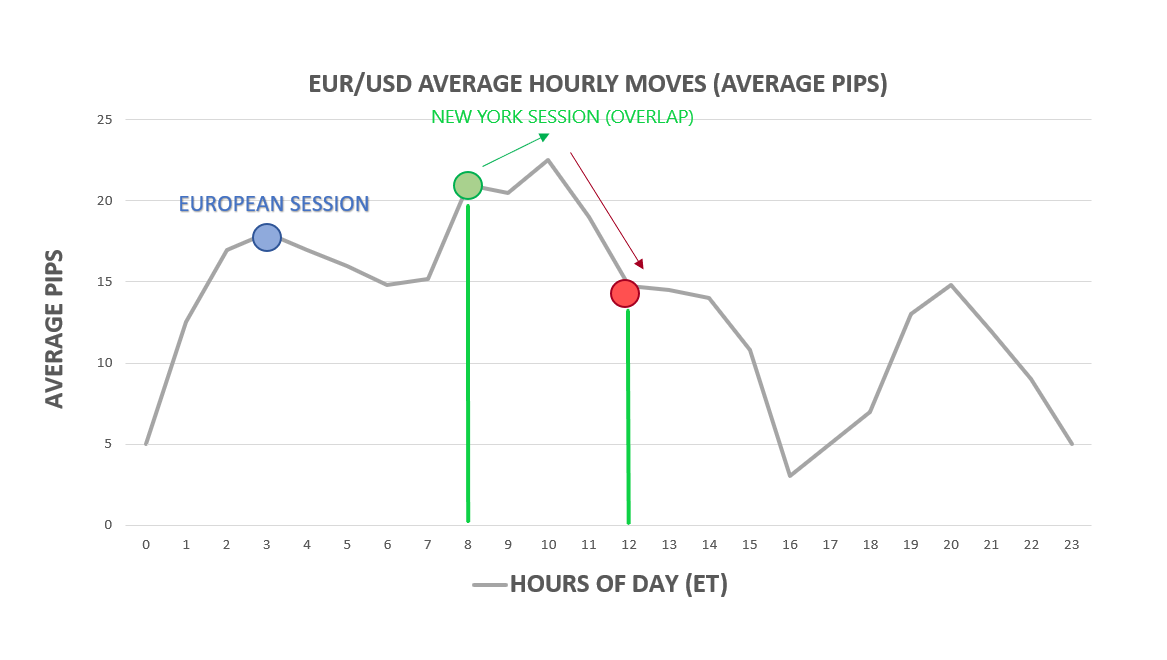
To trade the overlap, traders can use a break-out strategy which takes advantage of the increased volatility seen during the overlap.
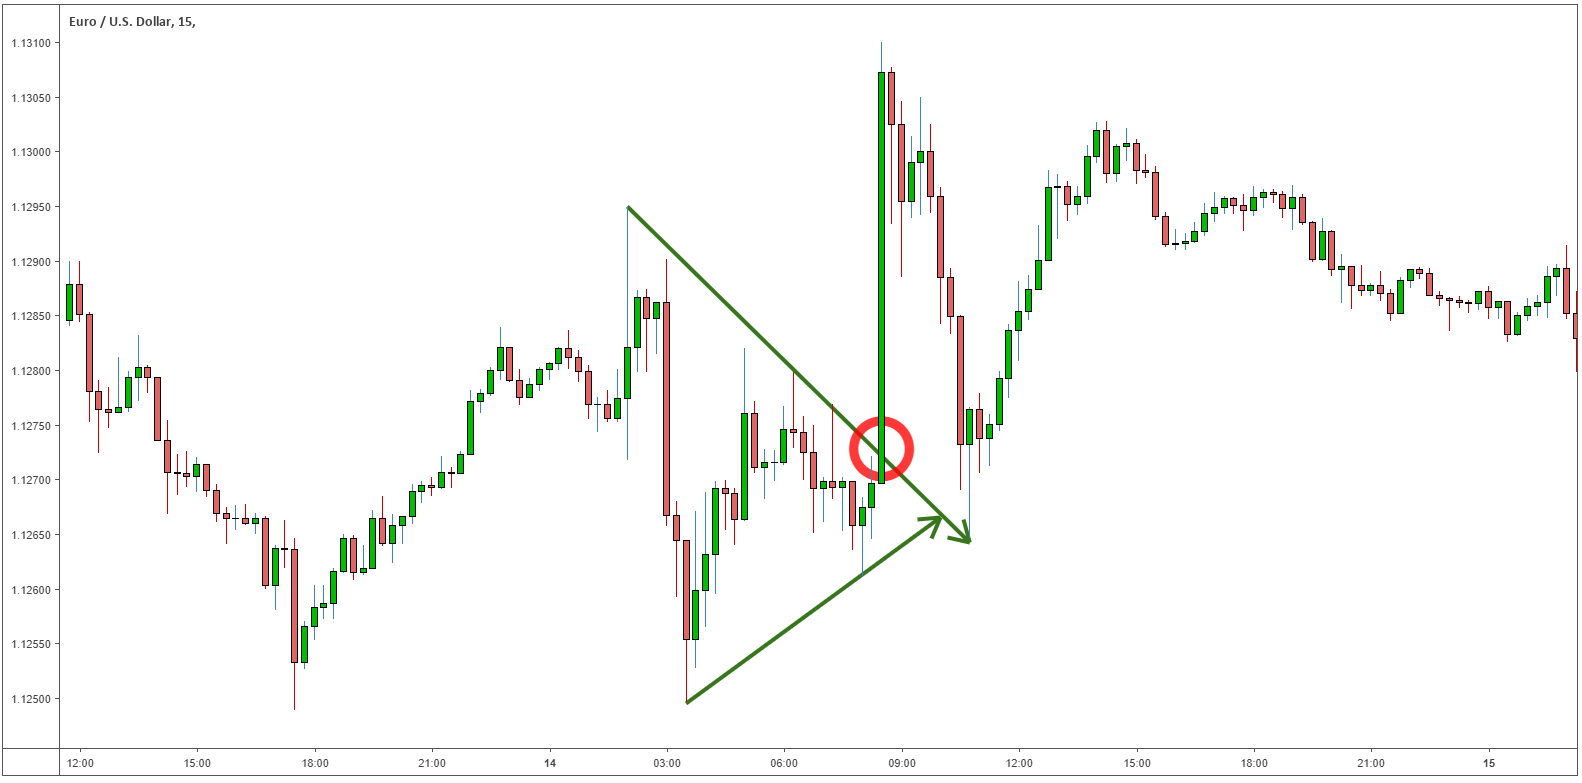
An example of the New York breakout strategy, using the EUR/USD, is shown below:
The EUR/USD formed a triangle-pattern which, during the overlap, the price of the EUR/USD broke out of. Once a trader has properly addressed risk management, the entry into the trade can be staged with any relevant mechanism of support and/or resistance.
TRADING THE LATER PART OF THE NEW YORK SESSION
As London closes for the day, volatility will have a tendency to decrease drastically. From the same chart we looked at above, that showed the average hourly moves by hour of day in EUR/USD, we can see a markedly different tone in the average hourly move for the later portion of the US forex trading session:
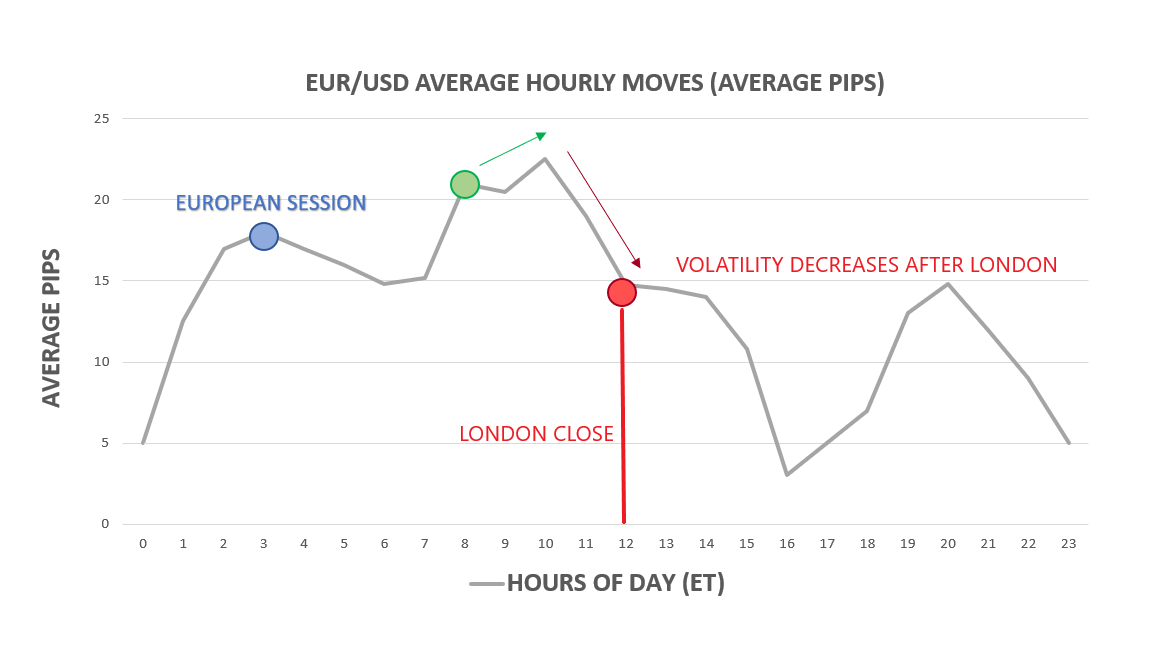
As you can see, the later part of the New York session displays less volatility. Since the average hourly moves are smaller in the later stages of the New York session traders could use a different trading strategy, like a range trading strategy.
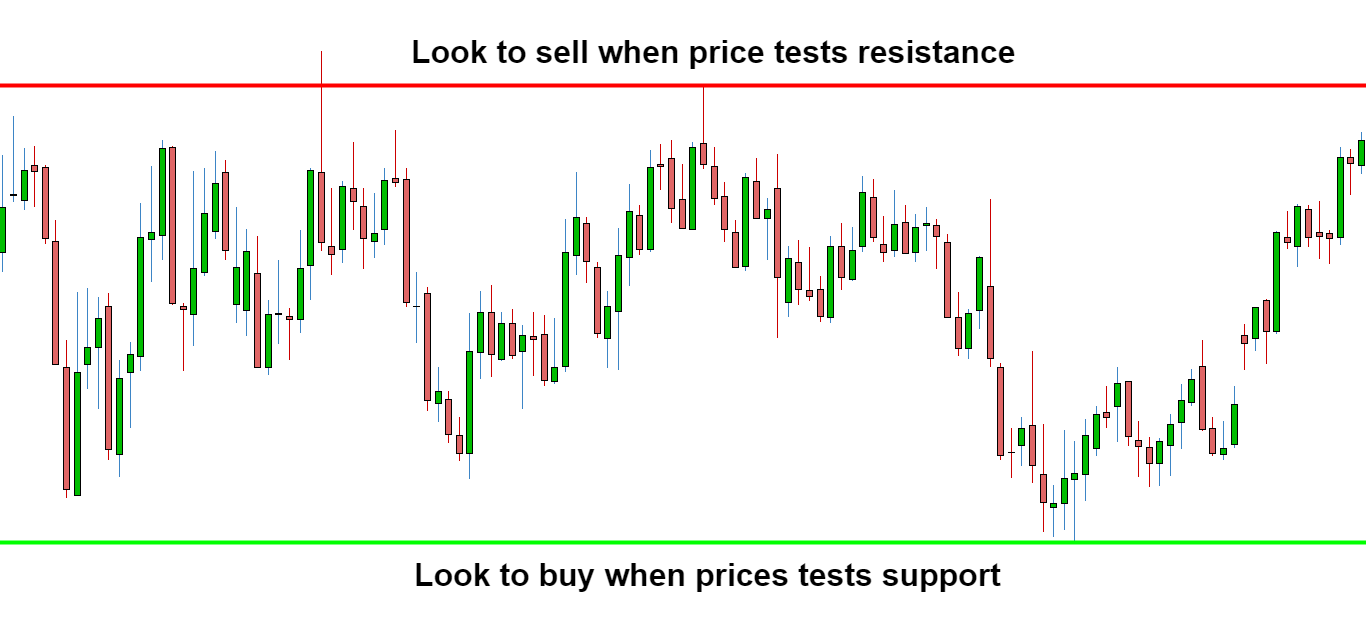
Using a range trading strategy trader take advantage of support and resistance levels. The chart below shows an example of a range trading strategy. When the price moves the upper bound (red line) traders will look to short the currency pair. When the price moves the lower bound (the green line) traders will look to buy the currency pair.
The logic behind using a range trading strategy is that as the volatility lowers, the levels of support and resistance may be harder to break and will therefore more likely hold- benefiting the range bound trading strategy.
BEST FX PAIRS TO TRADE DURING THE NEW YORK SESSION
The best forex pairs to trade during the New York session would be your majors, like EUR/USD, USD/JPY, GBP/USD, EUR/JPY, GBP/JPY, and USD/CHF. These pairs will be the most liquid during the US session, especially the EUR/USD during the overlap.
Each forex trading session has unique characteristics, the London forex trading session follows the New York session which is then followed by the Asia trading session.
The liquidity will lead to reduced spreads and therefore, lower trading costs. During the overlap, the combination of increased volatility and increased liquidity will be beneficial to most forex traders.
TAKE YOUR FOREX TRADING TO THE NEXT LEVEL WITH OUR GUIDES AND RESOURCES
If you’re new to forex trading, our New to Forex trading guide covers all the basics to help you on your journey. We also recommend reading our guide to the traits of successful traders, which comprises the data of over 30 million live trades analyzed by our research team.
By David Bradfield, Markets Writer, 28th December 2021. DailyFX


1 Comment
Recommended Comments
Create an account or sign in to comment
You need to be a member in order to leave a comment
Create an account
Sign up for a new account in our community. It's easy!
Register a new accountSign in
Already have an account? Sign in here.
Sign In Now