Lagging Indicators Defined and Explained

Entry posted by MongiIG in Market News
635 views
- Reviewed by James Stanley, Nov. 24, 2021
Lagging indicators are often misunderstood in their foundations however, they are a great way to analyse financial markets. This article will outline:
- What lagging indicators are
- Examples of lagging indicators
- Benefits of lagging indicators
WHAT IS A LAGGING INDICATOR?
A lagging indicator is a tool used by traders to analyse the markets using an average of previous price action data. There are multiple lagging indicators, all of which are used to examine market trends, entry and exit points.
Lagging indicators are presumed to be most effective during trending markets however, many signals occur after the actual trade movement has occurred leaving traders fewer profitable pips.
WHAT ARE SOME EXAMPLES OF LAGGING INDICATORS?
The most frequently used lagging indicators are those pertaining to the moving average. Examples of these are the simple moving average (SMA), exponential moving average (EMA) and MACD – see below. All these indicators use past price movements alongside different formulae to create unique market signals. Further to this, these indicators can be edited to suit the trader by changing the defining parameters within each formula.
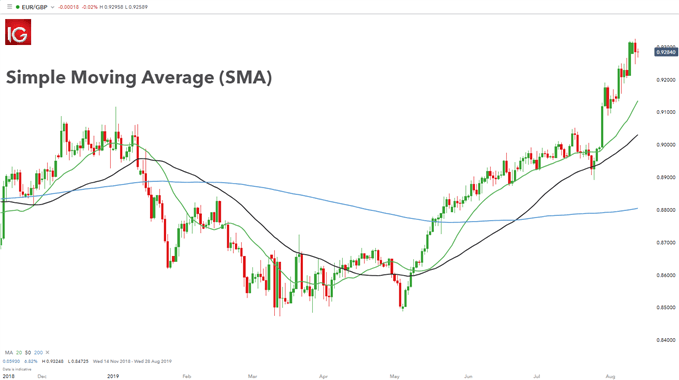
Simple Moving Average (SMA):
The SMA is a lagging indicator that characterises the average closing price of a financial instrument over a particular time frame.
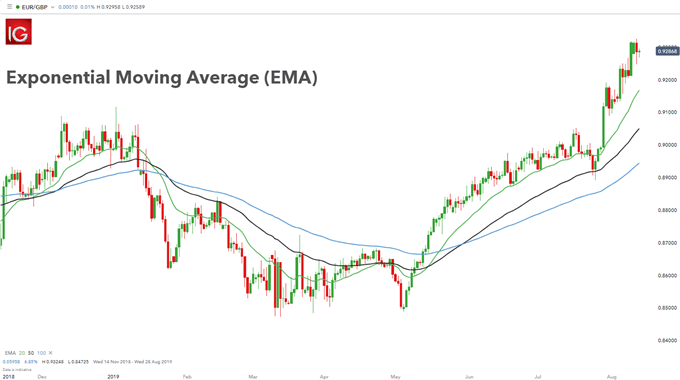
Exponential Moving Average (EMA😞
The EMA is a lagging indicator that is a resultant from the SMA calculation; the only difference being that the EMA favours more recent price movements.
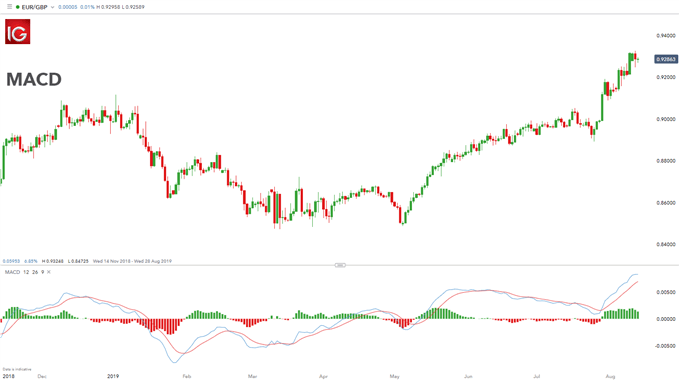
MACD:
The MACD is a lagging indicator that calculates the association between various EMAs.
BENEFITS OF LAGGING INDICATORS
There are several benefits of using lagging indicators that are often taken for granted by novice traders. Below is a list of these benefits which will assist traders in identifying when to implement them:
- The lagging aspect of indicators will get traders into trades that have greater confirmation behind them as they are based on more data. In other words, the indicator will force traders to wait a bit before entering
- Entry and exit points can be identified
- Lagging indicators work extremely well in strong trending markets
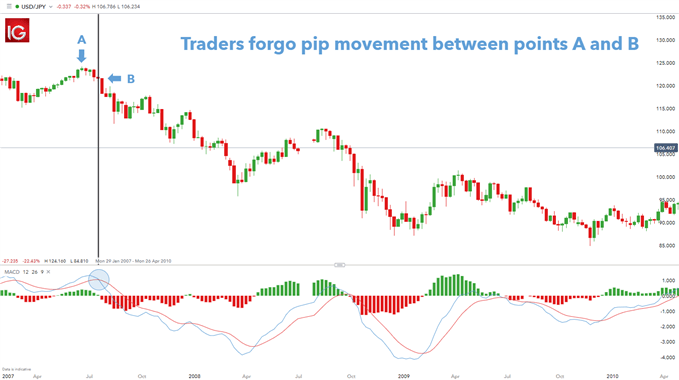
The weekly chart below depicts a trading strategy on USD/JPY using a MACD crossover strategy. Entry occurs when the MACD line crosses the signal line as highlighted. Initially traders forgo the positive price movement between point A and point B on the chart due to the lagging nature of MACD. However, after entry the trade is set up to maximize the pip movement from point B through to the swing low. As can be seen in this example, traders can be successful even though there are some forgone gains prior to entry.
LAGGING INDICATORS: A SUMMARY
Lagging indicators are a great tool to utilise when trading the markets. They are extremely flexible in what they offer which can enhance a trading strategy or provide additional support to a trader’s analysis. These indicators are a great tool to understand and potentially incorporate into every trader’s repertoire.
BECOME A BETTER TRADER WITH OUR TRADING TIPS
- Expand your trading knowledge by reading our article on some of the most popular technical indicators
- Further your knowledge on leading indicators
- For more information on the indicators you should know, check out the more condensed 4 Effective Trading Indicators Every Trader Should Know
Dec 28, 2021 | Warren Venketas, Analyst | DailyFX


0 Comments
Recommended Comments
There are no comments to display.
Create an account or sign in to comment
You need to be a member in order to leave a comment
Create an account
Sign up for a new account in our community. It's easy!
Register a new accountSign in
Already have an account? Sign in here.
Sign In Now