Tesco at 11-year highs, flirts with psychological mark

Entry posted by MongiIG in Market News
618 views
Tesco’s share price is on track to reach its fourth monthly gain in a row.
 Source: Bloomberg
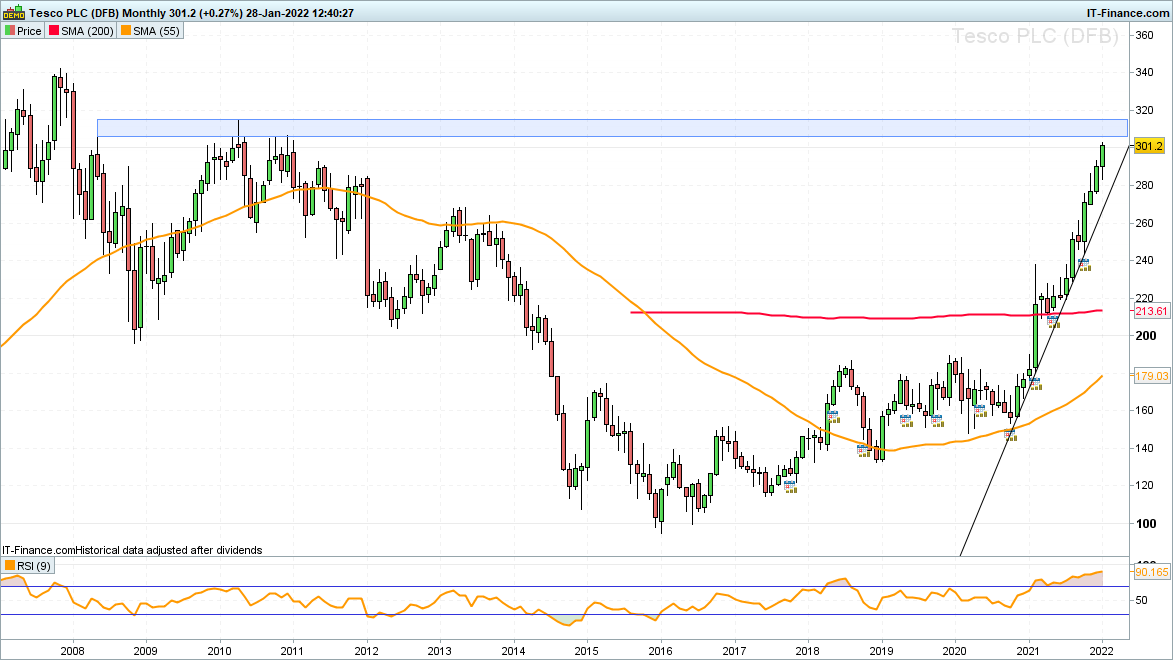
Tesco’s share price is going from strength to strength and is trading in 11-year highs. It is currently flirting with minor psychological resistance at 300. This is likely to soon give way to the 305.90 to 306.80 May 2008, October and December 2010 highs, though.
Between these and the April 2010 peak at 314.50 the steep advance seen since November 2020, having so far gained an impressive 93% compared to the FTSE 100’s 34%, is expected to peter out, at the very least in the short-term. A consolidation after such a strong and steep uptrend within a long-term resistance area would be completely normal. Were the share price to extend its gains even further the May 2007 high at 331.00 and the November 2007 peak at 342.00 would come into view.
 Source: ProRealTime
Since technical analysts tend to work in three timeframes it might make sense to analyse the Tesco share price chart within this context.
According to Dow Theory, dating back to the late 19th century, there are three trends: the primary or major trend, the secondary trend, which is corrective to the primary trend, i.e. moves in the opposite direction to the primary trend, and minor trends seen as ‘day-to-day’ fluctuations and are usually discarded as ‘noise’.
The primary trend is said to last from one to several years, the secondary trend from three weeks to three months and the minor trends are those seen on the daily price charts which technical analysts do pay great attention to, despite what Dow Theory stipulates.
This has to do with the fact that Charles Dow, the originator of the theory, was more interested in the state of the economy than in share prices per se. Modern traders and investors, however, are very keen on trading individual shares and thus need to analyse both the long- and the short-term technical picture.
 Source: ProRealTime
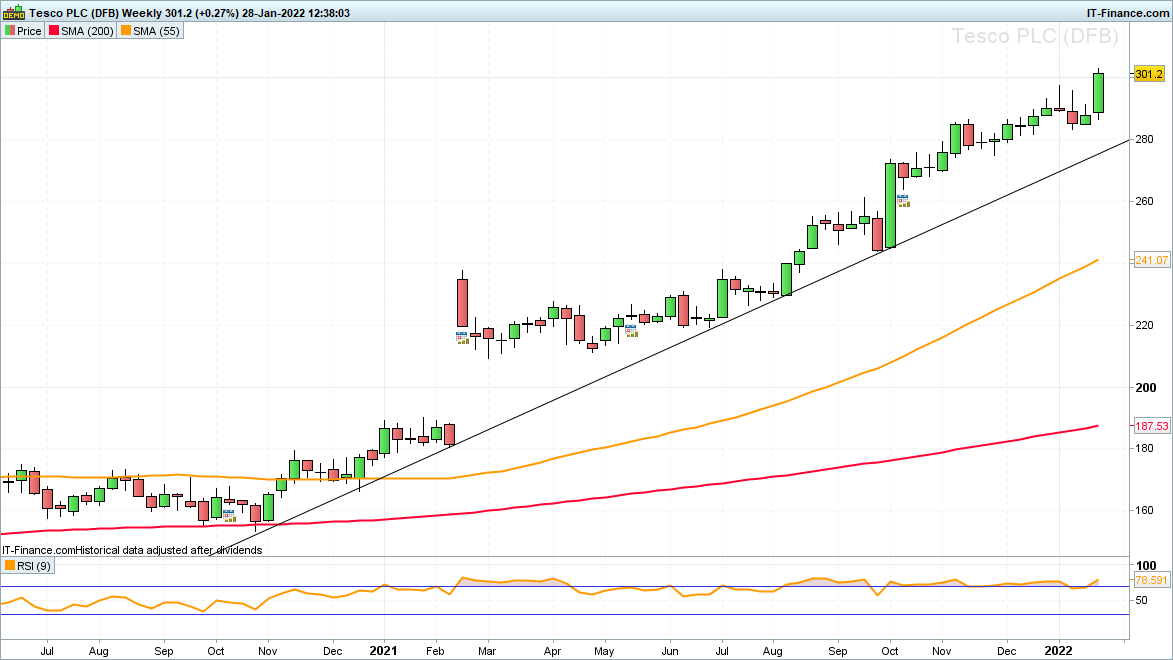
So, let’s look at the trends for Tesco. The primary trend is clearly up and the last secondary correction against this trend dates to November of last year. Since we are also interested in the shorter-term picture, we need to look at the daily chart.
 Source: ProRealTime
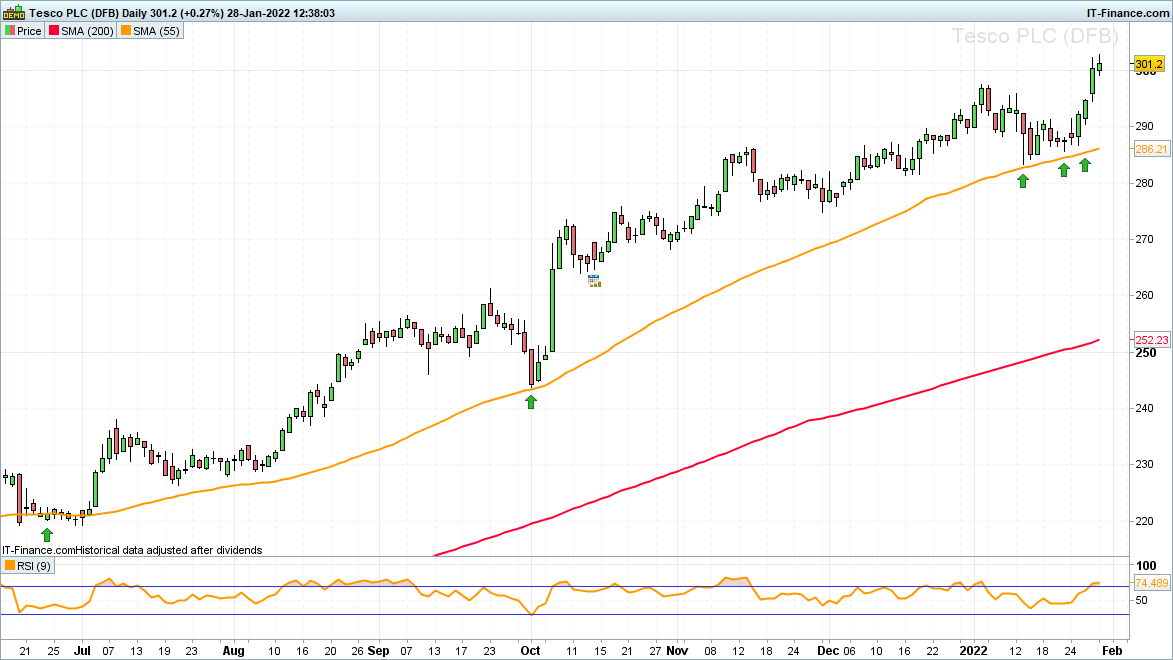
On it we can see how the 55-day simple moving average (SMA) has been acting as support and has been guiding the Tesco share price higher since June 2021.
In addition, we can clearly make out the last swing-low in mid-January at 283.30. While it underpins, the bulls remain in control. Minor support above it can be seen at the early January high at 297.50 and at the 12 January high at 295.90, as well as at the 19 January high at 291.30.


0 Comments
Recommended Comments
There are no comments to display.
Create an account or sign in to comment
You need to be a member in order to leave a comment
Create an account
Sign up for a new account in our community. It's easy!
Register a new accountSign in
Already have an account? Sign in here.
Sign In Now