Fibonacci Confluence on FX Pairs

Entry posted by MongiIG in Analyst Piece
1,219 views
Talking Points:
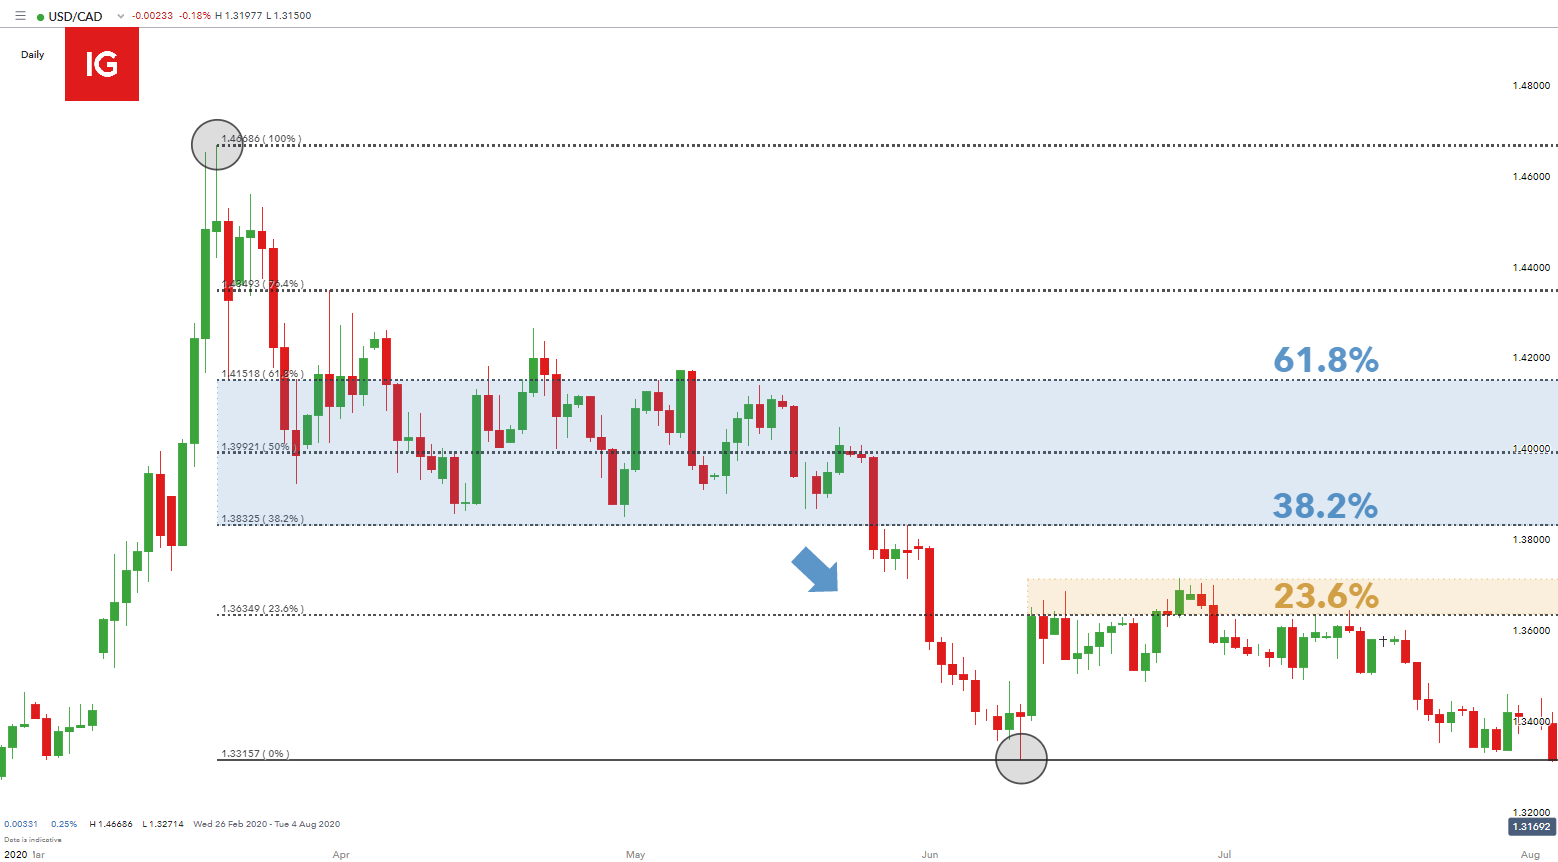
- As looked at earlier in this module,Fibonacci retracements can help traders to identify possible support/resistance.
- We’ve previously discussed how a trader can use Fibonacci retracements on long-term-charts, and by focusing on multiple major moves traders may be able to glean confluent areas of support/resistance. This can provide multiple reasons for buyers or sellers to defend these key spots on the chart, keeping the door open for reversals or retracements.
Fibonacci is wrapped in mystique, and this makes the story around it that much more interesting. But for applicability in markets, the simple version is that Fibonacci retracement levels offer potential areas for support and/or resistance to develop; and because market participants may use these levels in their analysis and, in turn, because these prices have potential impact for price behavior, this can be an excellent addition to the FX traders repertoire of support and resistance analysis.
Origins
Italian mathematician Leonardo Fibonacci is credited with finding the Fibonacci sequence in the 13th century, hence the name ‘Fibonacci’. And while his book Liber Abaci introduced the Fibonacci sequence to the western world, traces can actually be found going back as far as 200 BC in Indian mathematics. The sequence is fairly simple: Two numbers added together produce the next value. So 1+1 = 2, and then 1+2 = 3, and then 2+3 = 5, 5+3 = 8, and so on. The first 22 values of the Fibonacci sequence are printed below:
1, 1, 2, 3, 5, 8, 13, 21, 34, 55, 89, 144, 233, 377, 610, 987, 1597, 2584, 4181, 6765, 10946, 17711
This starts to get interesting once we look at the numbers relationship within the sequence to each other. If we take a value and divide by the preceding value, we will get a number approximately close to 161.8%. So, each number in the sequence is 161.8% greater than the prior value after we get out of the initial portion of the sequence (after the value of 89). This is the Golden Ratio of 161.8%.
17711/10946 = 1.61803
10946/6765 = 1.61803
6765/4181 = 1.61803
What struck Fibonacci almost a thousand years ago and the same thing that amazed a thousand years before that is how widely this ratio, and this sequence can be found in the world around us. In Liber Abaci, Fibonacci used the mating cycle of rabbits as an example, showing how rabbit populations in isolation would grow according to the numerical sequence of 1, 1, 2, 3, 5, 8, 13, etc. But this is just the tip of the iceberg, the number of flower petals will often follow the sequence: Lilies have three petals while buttercups have five, chicory’s have 21 and daisies have 34. Each petal is placed at .618 per turn in order to allow for maximum sunlight. Tree branches, in the way that trunks split and in the way that branches will grow, display the Fibonacci sequence. Shells, hurricanes – even human faces adhere to the Golden ratio in a geometric spiral pattern.
Right now, you can look down at your right arm to notice that you probably have eight fingers, five on each hand, three bones in each finger,two bones in each one thumb and one thumb on each hand. Oh – and the ratio between your forearm and hand – that probably applies by the Golden ratio, as well.
Applicability to Markets
While the application of Fibonacci in nature keeps many graduate level mathematics students busy, traders have more pressing concerns: Applying the study to financial markets. In its most common form, Fibonacci is the use of the golden ratio in support and resistance analysis. So, plot a significant move, draw a line at 61.8% of that move, and we have an area to watch for a possible retracement to find support. The reciprocal of .618 is .382, so this gives us another value to work with at the 38.2% level.
On the chart below, we’re looking at the lifetime move in EUR/USD, taking the low in the year 2000 up to the high in 2009. We start at the beginning of the move and draw the retracement to the top, and 38.2% of the way-down we can see the retracement at 1.3056. We can also see the 61.8% retracement of this move at 1.1212. Notice how this level helped to set resistance in the pair for 15 out of 30 months after the level came into play in January of 2015. As EUR/USD was dropping like a rock in anticipation of ECB QE coming online in a few short months, we caught support at this level on the way down in January of 2015; but after that we had eight consecutive months of resistance showing at or around this key 61.8% retracement level.
EUR/USD Monthly: 15 of 30 Months with Resistance at 61.8% Retracement, 3 Months of Support
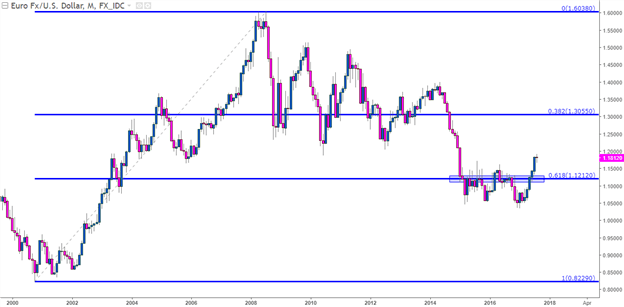
Chart prepared by James Stanley with TradingView Charts
The past few months have been quite the wild ride for EUR/USD. After a rather threatening drop around the U.S. Presidential Election leading into the start of 2017 (shown in red below), the pair put in an aggressive reversal as bulls have run amok. But – when prices were in the process reversing from the prior bearish mode into a more bullish state, the 38.2% retracement of the post-Election move showed up as a bit of support (shown in green) before the 61.8% retracement provided a bit of resistance (indicated with purple). After prices broke above those highs and ran with reckless abandon, resistance has begun to show at the 161.8% extension of that move (orange box).
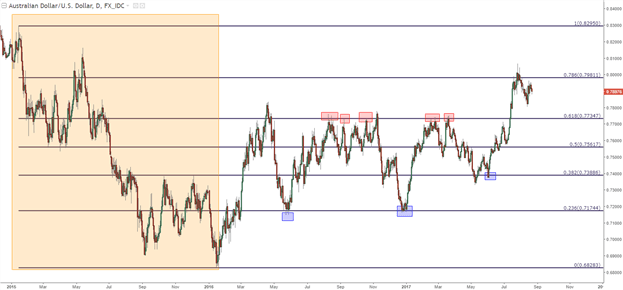
Chart prepared by James Stanleywith Tradingview charts
Notice that while the above chart is far from perfect in the fact that it did not catch every point of support or resistance, it did show quite a few. As we discussed in our last article, the prospect of confluence can incorporate levels from different styles of analysis, such as psychological whole numbers.
On the below chart of AUD/USD, we took the same Fibonacci retracement above and added in levels for the psychological levels at .7000, .7500 and .8000, along with a price action swing indicated with a green box. Notice, that while we don’t catch every top or bottom, we catch quite a few of them with these very simple forms of analysis. And that resistance that held in the pair around the 61.8% retracement, that level is confluent with the .7750 psychological level, and this is likely why that level was so difficult for bulls to break through.
AUD/USD Daily: Confluence of Support and Resistance
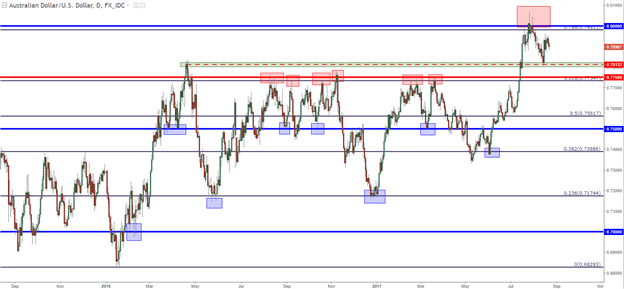
Chart prepared by James Stanley with Tradingview charts
With this system of support and resistance in the analytical quiver of traders, price action can be utilized to figure out how to trade with each of these potential support or resistance inflections based on the context of that market’s condition at a specific point in time.
If you would like to try drawing Fibonacci retracements, this tool is available on IG’s platforms, and can be accessed with a demo account. To sign up for a demo account with IG Group, please click here.
Feb 11, 2022 | James Stanley, Senior Strategist. DailyFX


0 Comments
Recommended Comments
There are no comments to display.
Create an account or sign in to comment
You need to be a member in order to leave a comment
Create an account
Sign up for a new account in our community. It's easy!
Register a new accountSign in
Already have an account? Sign in here.
Sign In Now