Hang Seng and ASX tumbled after Russia attacked Europe’s largest nuclear plant

Entry posted by MongiIG in Market News
429 views
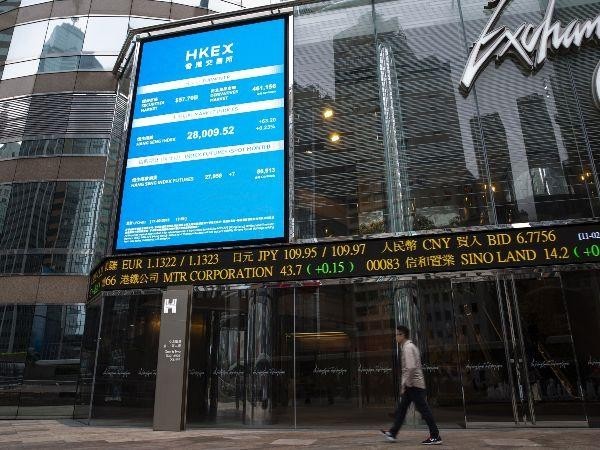
The global financial market was shocked by the news that Europe's largest nuclear power plant in Eastern Ukraine came under attack from Russian troops.
 Source: Hang Seng
The global financial market was shocked by the news that Europe's largest nuclear power plant in eastern Ukraine came under attack from Russian troops. During Friday's early trading session, the Asian stock market tumbled as the Hang Seng dropped over 2.5%, ASX slid 1.5% lower and Japan's share market dipped by more than 2%.
On the other hand, the US dollar and commodity prices rallied as investors rushed to safe assets amid the deepening tension. By the time of writing, the US dollar index rose 0.3%, while the 10-year US treasury bonds fell seven basis points. Oil price jumped over 2%, natural gas rose 1.78%, and gold moved 0.6% higher.
Hang Seng
Hong Kong’s share market is sinking towards a new low this week. The market is under heightened pressure caused by a deluge of negative catalysts including the Ukraine crisis, the city’s rising Covid cases, and the tightening control by Beijing. Moreover, this coming weekend China will likely announce its lowest economic growth target in more than three decades to seal the view of a cloudy economic prospect for Asia’s super-power nation.
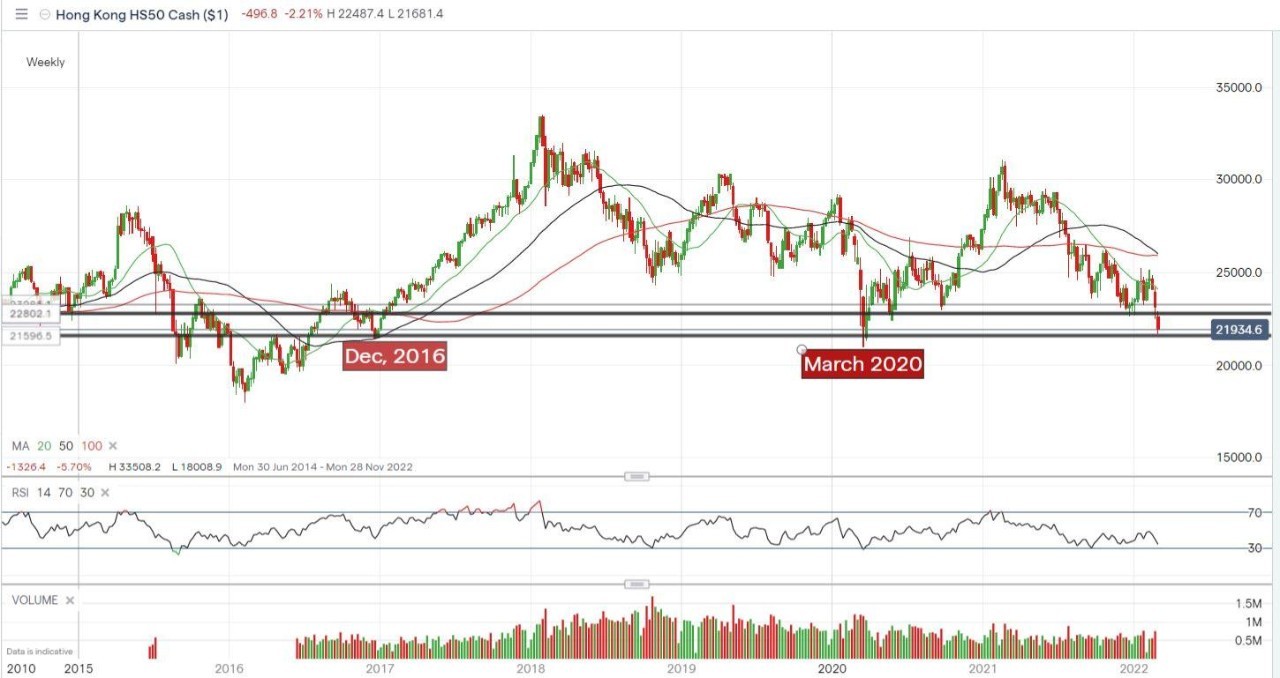
From a technical viewpoint, the index has broken through a major support (around 22802) for the past two years, together with a psychological bench mark at 22000.
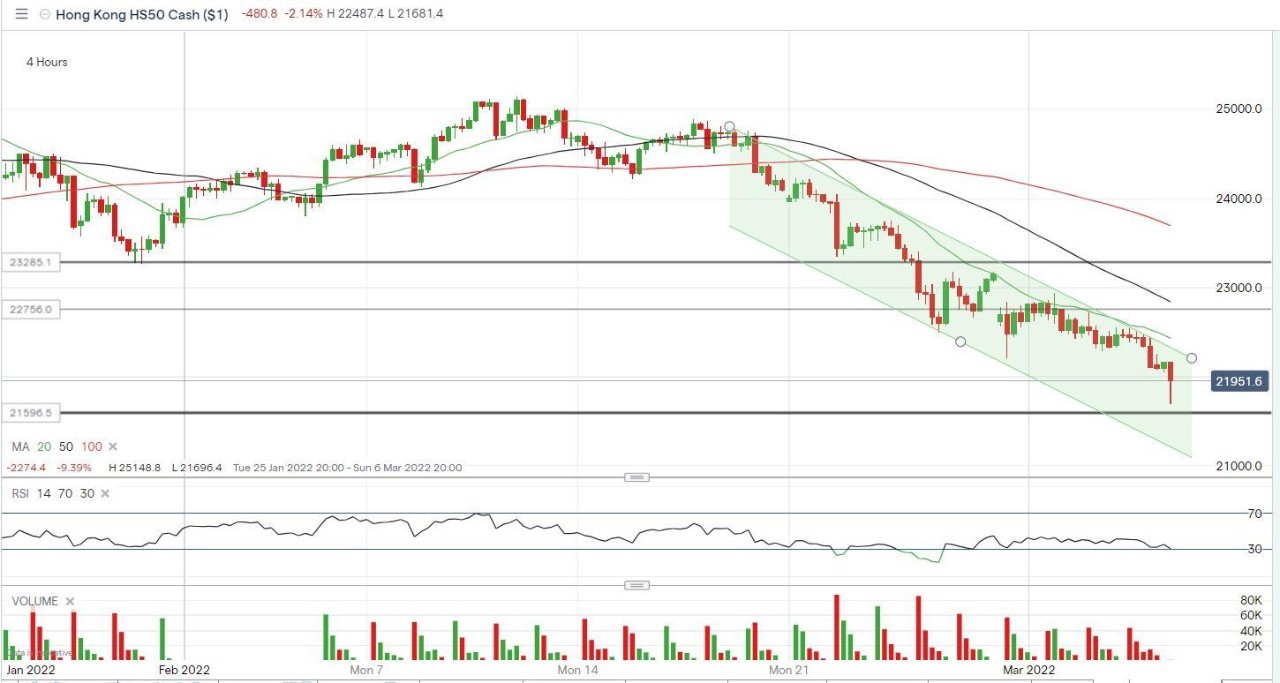
From the weekly chart, it seems the imminent support for the Hang Seng should be the two-year-low level created from the Feb/March 2020’s crash, at around 21490 to 21596. However, breaking down to this level will bring the index back to its floor level for the past five years. The 4-hour chart shows the price has been moving within the descending tunnel for the last fortnight and suggests the upper boundary of the slim band near 22257 is expected to be a primary source of selling pressure.
Hang Seng Weekly Chart
 Source: IG
Hang Seng 4-hour chart
 Source: IG
ASX 200
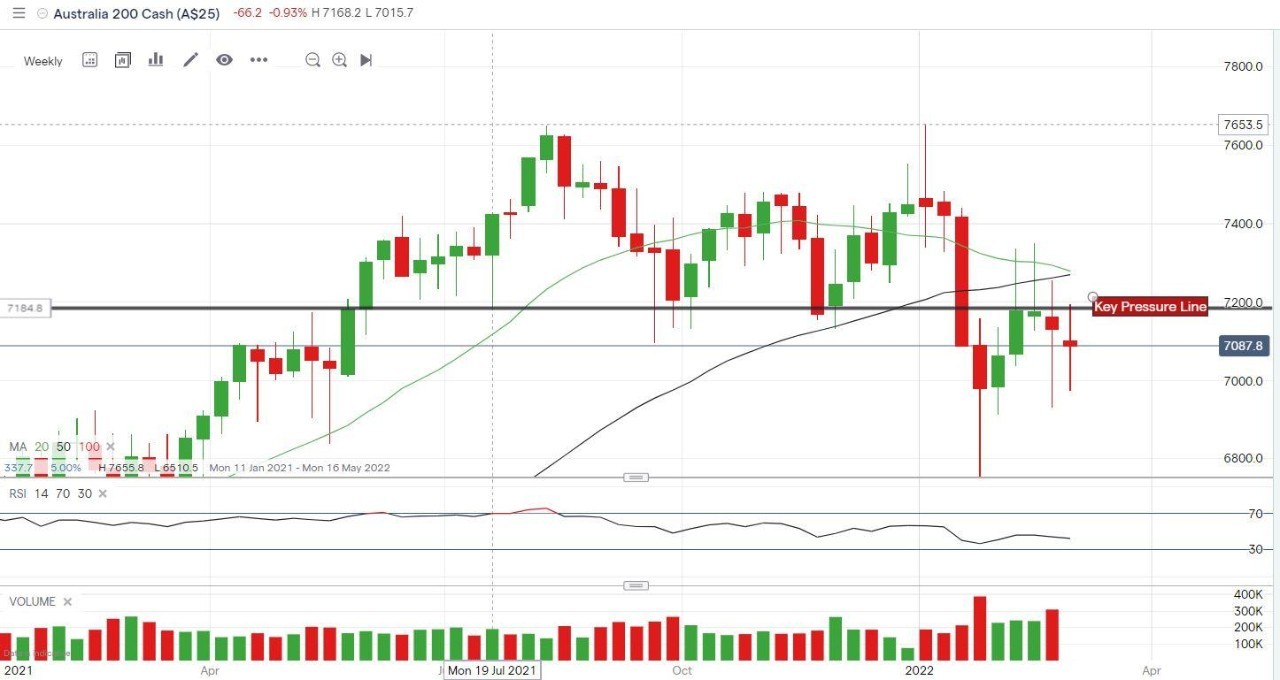
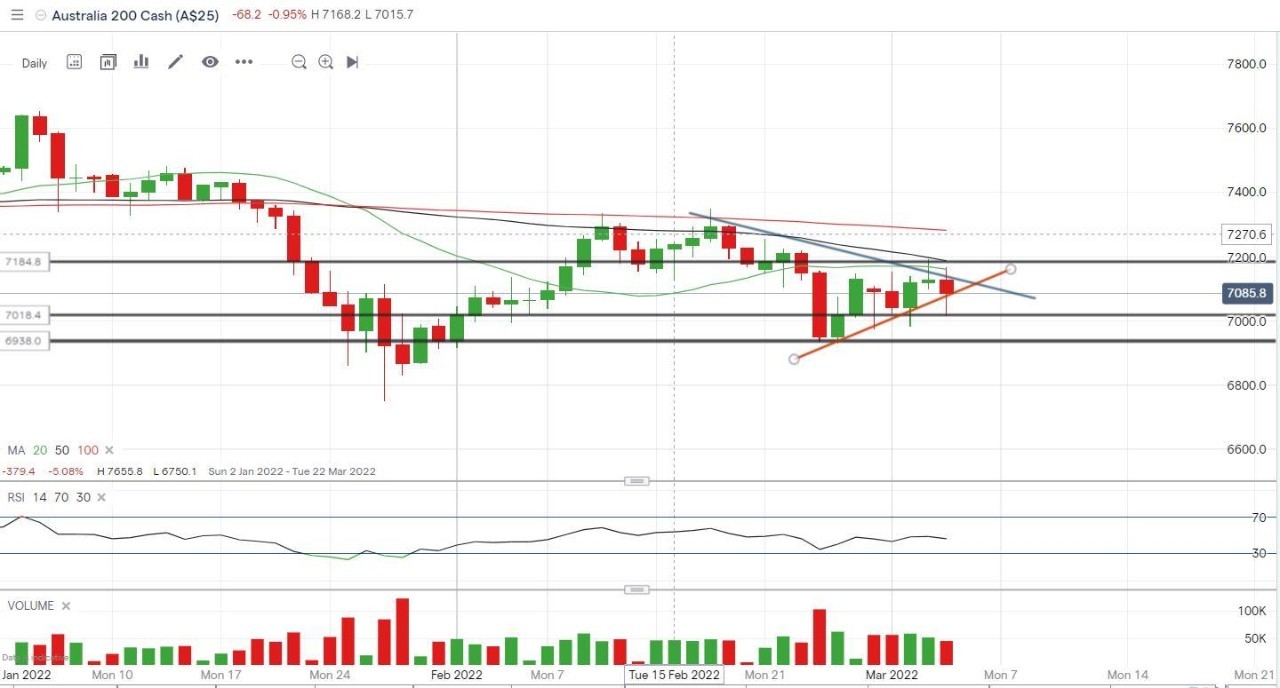
The fire in eastern Ukraine has also paused the ASX’s upward journey this week. After Friday’s fall, the index has been stopped by the “shoulder line” around 7184 for the six straight weeks. On the daily chart, the index is approaching the vertex of the triangle shape. Both can be viewed as an early sign for an overturn.
If the index manages to push higher, this week’s trend line from the daily chart will act as key support and bring the price to re-challenge the 7184 level. However, if the index breaches below this line next week, the next level in view will be 7018.
ASX Weekly Chart
 Source: IG
ASX Daily Chart
 Source: IG
Take your position on over 13,000 local and international shares via CFDs or share trading – and trade it all seamlessly from the one account. Learn more about share CFDs or shares trading with us, or open an account to get started today.


0 Comments
Recommended Comments
There are no comments to display.
Create an account or sign in to comment
You need to be a member in order to leave a comment
Create an account
Sign up for a new account in our community. It's easy!
Register a new accountSign in
Already have an account? Sign in here.
Sign In Now