Wall Street at risk as retail traders boost long exposure

Entry posted by ArvinIG in Analyst article
831 views
Retail traders are increasing upside exposure on Wall Street and this is offering bearish signals for S&P 500 and Dow Jones.
Source: Bloomberg
In recent days, the S&P 500 and Dow Jones have been aiming cautiously lower, reversing some of the upside progress seen throughout March. This is as retail traders have been slowly increasing their upside exposure on Wall Street, as seen using the IG Client Sentiment (IGCS) indicator. The latter can at times function as a contrarian indicator. With that in mind, is there more pain in store for Wall Street ahead?
S&P 500 sentiment outlook - bearish
The IGCS gauge shows that about 52% of retail traders are net-long the S&P 500. Since the majority of them are biased to the upside, this hints that prices may continue falling. Over the past day and week, downside exposure has decreased by 6.1% and 14.7% respectively. Taking these into consideration, recent shifts in positioning are offering a stronger bearish contrarian trading bias.
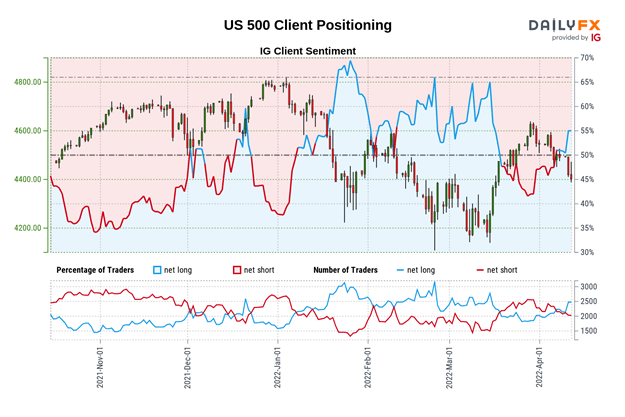
Source: DailyFX
S&P 500 futures daily chart
Taking a look at the daily chart, the S&P 500 could be carving out a bearish Head and Shoulders chart formation. The left shoulder has its beginnings from the summer of 2021, with the head peaking at the all-time high of 4808.25. Prices recently formed the right shoulder after finding a high of 4631 in March. Getting back to the neckline would place the focus on the 4101 – 4140 support zone.
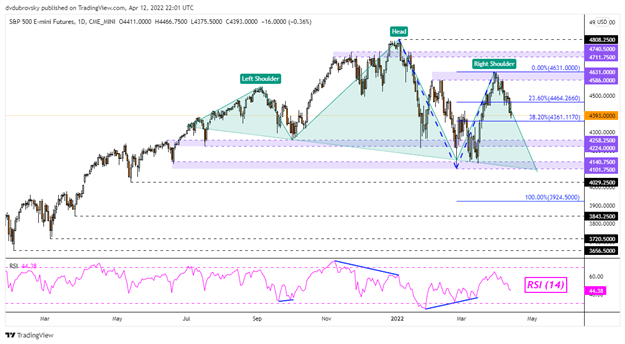
Source: TradingView
Dow Jones sentiment outlook - bearish
The IGCS gauge shows that 46% of retail traders are net-long the Dow Jones. Since most traders are still biased to the downside, this is a sign that prices may continue rising. Upside exposure has fallen by 5.2% compared to the past 24 hours. This is as downside bets declined by 6.42% over the same time. With that in mind, it seems that the Dow may soon reverse lower despite most retail investors remining net-long.
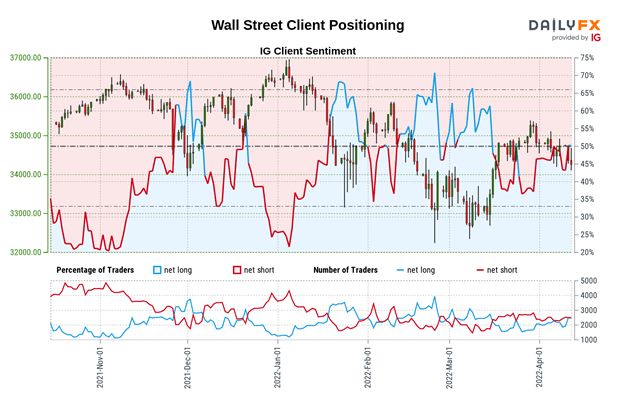
Source: DailyFX
Dow Jones futures daily chart
From a technical standpoint, Dow Jones futures may be vulnerable to further losses. Prices recently confirmed a bearish Evening Star candlestick pattern. Immediate support appears to be the 34002 inflection point. Clearing the latter then exposes the wide range of support between 32902 – 33623. Turning higher and closing above 35281 may open the door to revisiting the February peak at 35752.
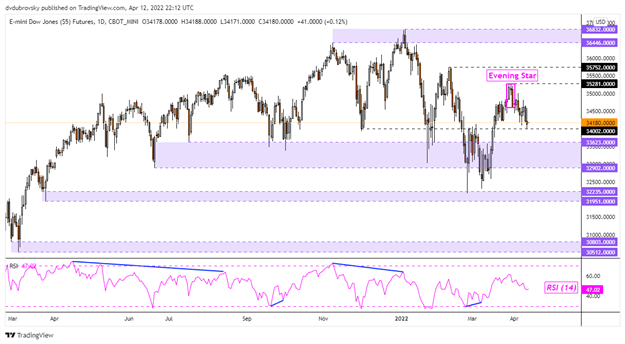
Source: TradingView
This information has been prepared by DailyFX, the partner site of IG offering leading forex news and analysis. In addition to the disclaimer below, the material on this page does not contain a record of our trading prices, or an offer of, or solicitation for, a transaction in any financial instrument. IG accepts no responsibility for any use that may be made of these comments and for any consequences that result. No representation or warranty is given as to the accuracy or completeness of this information. Consequently any person acting on it does so entirely at their own risk. Any research provided does not have regard to the specific investment objectives, financial situation and needs of any specific person who may receive it. It has not been prepared in accordance with legal requirements designed to promote the independence of investment research and as such is considered to be a marketing communication. Although we are not specifically constrained from dealing ahead of our recommendations we do not seek to take advantage of them before they are provided to our clients.
Daniel Dubrovsky | Currency Analyst, DailyFX, San Francisco
13 April 2022


0 Comments
Recommended Comments
There are no comments to display.
Create an account or sign in to comment
You need to be a member in order to leave a comment
Create an account
Sign up for a new account in our community. It's easy!
Register a new accountSign in
Already have an account? Sign in here.
Sign In Now