When will be the right time to buy Apple shares?

Entry posted by MongiIG in Market News
1,052 views
Apple share price rout continues. Now is probably not the right time (yet) to buy the stock despite the company entering the BNPL space.
 Source: Bloomberg
At last week’s Apple Worldwide Developers Conference (WWDC) the company announced amidst its usual bevy of changes and updates to its hardware and software that it plans on entering the “buy now, pay later” (BNPL) financial space.
Apple has, of course, been a consumer finance company for many years, thanks to its widely used ‘Apple Pay’ service and the launch of a branded credit card in recent years. However, while it has built up sufficient scale as to matter in the consumer financial technology market, it’s not considered a fintech company per se, not yet anyway.
With Apple’s announcement of a new service called ‘Apple Pay Later’ this may soon change, though. The service will allow consumers to make online or mobile purchases split into four payments over six weeks at the millions of US retailers that already accept Apple Pay.
The company said that since it has access to its 1.8 billion users’ transaction histories and as it will use Apple IDs for fraud prevention, it will only require a “soft” credit check in the US to begin with.
The new feature is expected to boost Apple Pay usage and is anticipated to lead to an ever-growing financial relationship with Apple users. Unlike most financial firms which provide "buy now, pay later" services and which use third-party credit reports to judge whether they wish to offer credit to new and existing customers, the iPhone maker will be keeping these in-house. Customers will be required to link their debit card to their Apple account, with payments automatically deducted from their bank account every couple of weeks, unless the customer chooses to opt out.
With this in mind, a subsidiary called Apple Financing LLC has been created, giving Apple more direct control over its ‘Apple Pay Later’ service. As a wholly owned subsidiary, Apple is also able to provide information to the subsidiary that wouldn't necessarily be provided to a third-party provider.
By performing credit checks in-house and using data that it directly manages, Apple is on its way to becoming a lender in its own right. This is a step up from deferring to a third-party firm such as Goldman Sachs with whom it partnered for the creation of the ‘Apple Card’.
Where to next for the Apple share price?
 Source: IT-Finance.com
Despite the potentially very profitable BNPL venture, Apple’s share price seems to be mirroring that of the S&P 500 but in a worse way, having declined by close to 28% year-to-date, whereas the S&P 500, although trading in bear market territory, is down around 21%.
The higher-than-expected year-on-year (YoY) US inflation data release of 8.6%, a 40-year high, last Friday made both the Apple share price and S&P 500 keel over after a brief two-week period of risk-on sentiment.
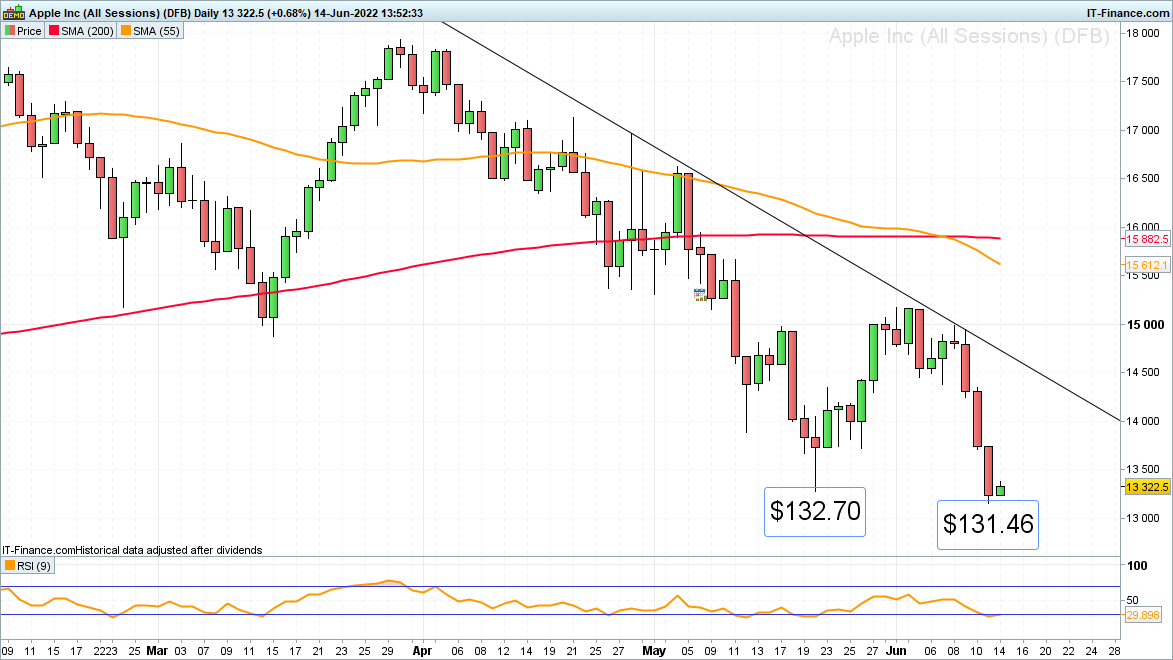
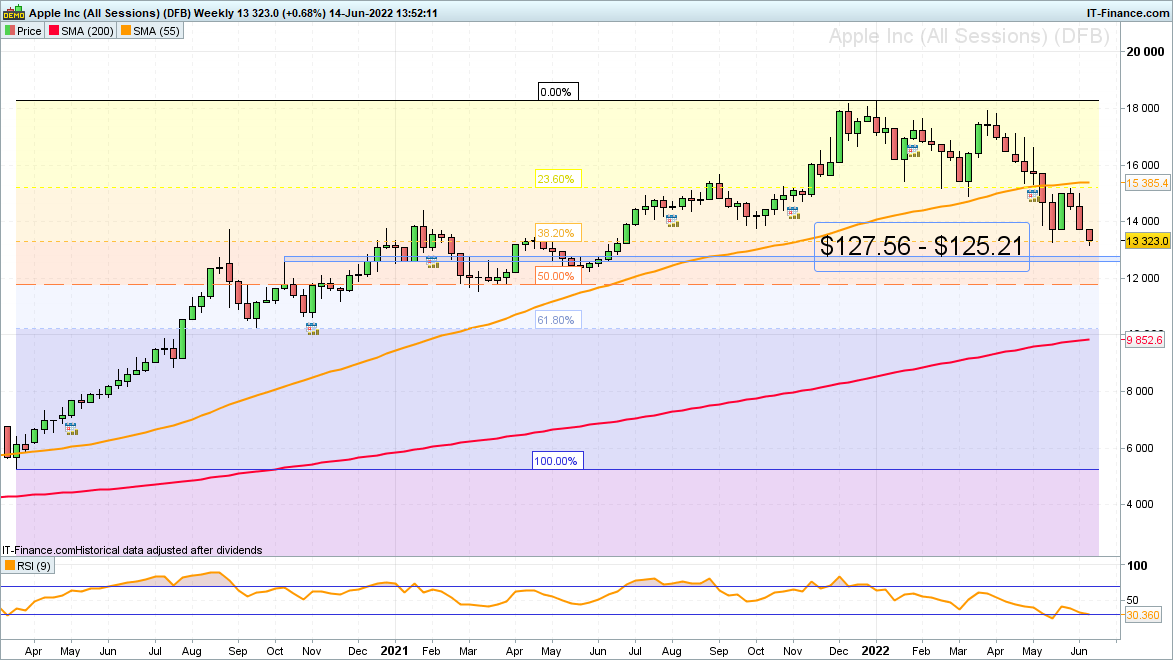
For the Apple share price, a drop and daily chart close below this week’s low at $131.46 would confirm the resumption of its bear trend with the $127.56 to $125.21 zone being targeted. It consists of the October 2020 and March 2021 highs and the January 2021 low.
Another potential downside target area is made up of the 50% retracement of the 2020-to-2022 bull market and the March 2021 low at $117.60 to $115.28.
 Source: IT-Finance.com
Provided that the $131.46 current June low isn’t slipped through, unlikely as it seems at the moment, a minor retracement to the upside may take shape with the 12 May low at $138.82 representing the first upside target and the 7 June low at $143.81 another one.
For a bottom to be formed, a rise and daily chart close above the current June high at $151.71 would need to ensue, the chance looks very low at present.


0 Comments
Recommended Comments
There are no comments to display.
Create an account or sign in to comment
You need to be a member in order to leave a comment
Create an account
Sign up for a new account in our community. It's easy!
Register a new accountSign in
Already have an account? Sign in here.
Sign In Now