Euro technical outlook - EUR/USD is at a crossroads while EUR/JPY has picked up steam
EUR/USD has recovered from a test of the lows; yen depreciation sees EUR/JPY eyeing new highs and momentum might be the key but can EUR/USD break higher?

Source: Bloomberg
EUR/USD technical analysis
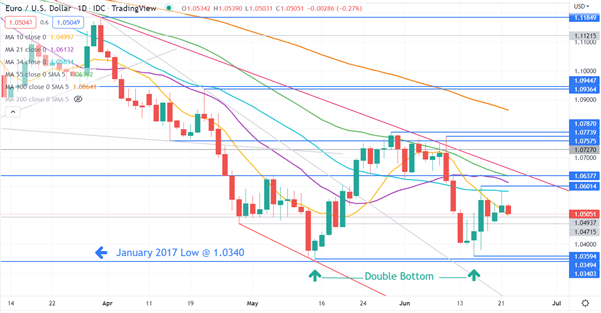
EUR/USD appears to be content to trade sideways for now after failing to break lower last week, hitting a low of 1.0359.
That move challenged last month’s low of 1.0349, which was above the January 2017 low of 1.0340. These levels may provide a support zone in the 1.0340 – 1.0360 area.
That move has also set-up a potential Double Bottom that might signal a reversal.
The price has moved above the 10-day simple moving average (SMA) but remains below the 21-, 34-, 55-, and 100-day SMAs, which could suggest bearish momentum is pausing.
A move above the nearby 34-SMA would further support this. All period SMAs have a negative gradient that is working against bullish momentum for now. A move back below the 10-day SMA might suggest a resumption of bearish momentum.
There is a cluster of resistance above the price with the 21-, 34- and 55-day SMAs among a previous high, a break point and a descending trend line. These all sit between 1.0580 and 1.0660. A break above 1.0660 could be significant.

Source: TradingView
EUR/JPY technical analysis
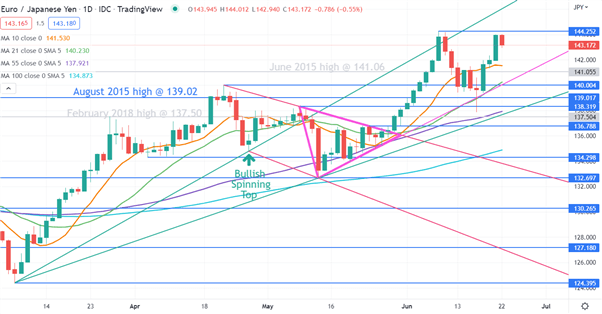
Bullish momentum appears to have resumed for EUR/JPY after breaking the top side of a Pennant formation last month.
At that time, the price re-asserted bullish momentum by moving above the 10-, 21-, 55- and 100-day simple moving averages (SMA).
Since then, it has gone on to make an 8-year high at 144.25 earlier this month and this could be a level of resistance.
The 21-, 55- and 100-day SMAs have positive gradients but the 10-day SMA has recently rolled over to negative. An uptick to the 10-day SMA could support further bullish momentum.
The subsequent pullback tried to break below an ascending trend line but was unable to follow through. Support may remain at the trend line, currently dissecting at a break point of 140.00.
Further down, support could be at the break points of 139.00, 138.32 and 136.79.
This information has been prepared by DailyFX, the partner site of IG offering leading forex news and analysis. In addition to the disclaimer below, the material on this page does not contain a record of our trading prices, or an offer of, or solicitation for, a transaction in any financial instrument. IG accepts no responsibility for any use that may be made of these comments and for any consequences that result. No representation or warranty is given as to the accuracy or completeness of this information. Consequently any person acting on it does so entirely at their own risk. Any research provided does not have regard to the specific investment objectives, financial situation and needs of any specific person who may receive it. It has not been prepared in accordance with legal requirements designed to promote the independence of investment research and as such is considered to be a marketing communication. Although we are not specifically constrained from dealing ahead of our recommendations we do not seek to take advantage of them before they are provided to our clients.


0 Comments
Recommended Comments
There are no comments to display.
Create an account or sign in to comment
You need to be a member in order to leave a comment
Create an account
Sign up for a new account in our community. It's easy!
Register a new accountSign in
Already have an account? Sign in here.
Sign In Now