Where to next for Coinbase shares?

Entry posted by MongiIG in Market News
1,597 views
With rivals such as Binance.US announcing it will offer zero-fee trading for Bitcoin as crypto currencies remain under pressure, how much further can Coinbase’s share price slide?
 Source: Bloomberg
Coinbase share price plunge
With Coinbase shares down over 85% from last year’s peak and rivals such as Binance.US announcing it will offer zero-fee trading for Bitcoin as crypto currencies remain under pressure, how much further can the company’s share price slide?
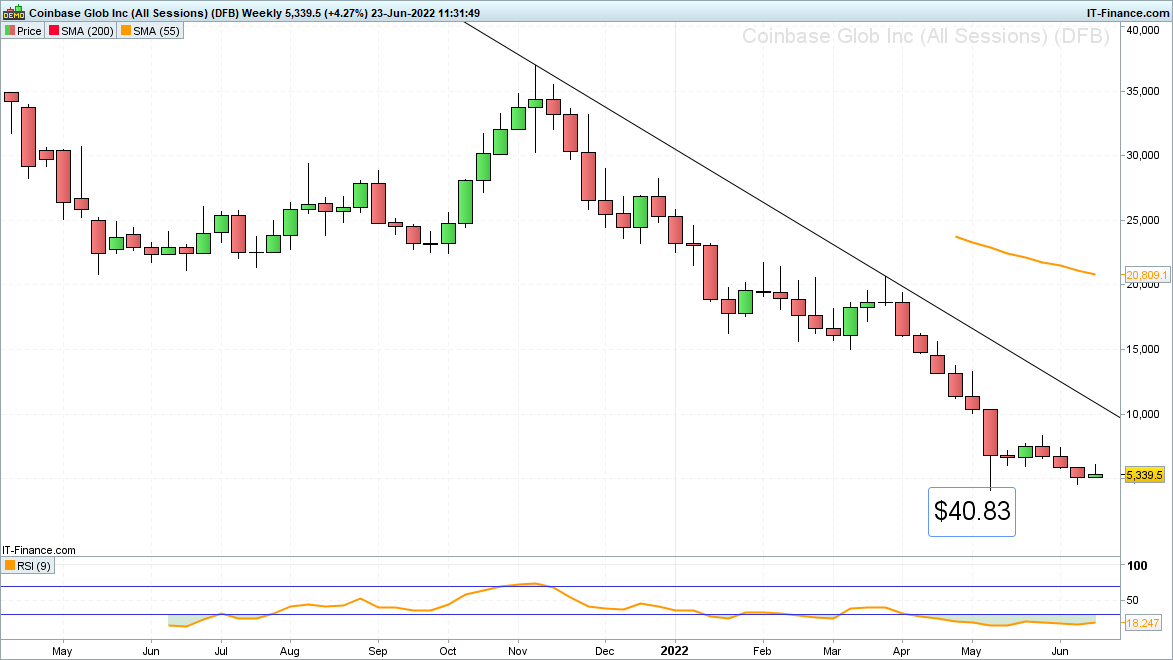
The short answer is much, much further. Simply because a stock is looking ‘cheap’ doesn’t mean that it cannot get cheaper still as traders have found out to their detriment by trying to ‘buy the dip’ over the course of this year in the Coinbase stock which once again is approaching its all-time low at $40.83, according to Google finance.
Short-term, that is to say over several days and up to three weeks, some counter-trend traders managed to make money by buying Coinbase shares, for example around the time when the company released its first quarter (Q1) results in mid-May which widely missed analyst estimates and led to the share price making an all-time low at $40.83.
The subsequent counter trend rally to the late May high, which took it to above the minor psychological $80 mark, made some investors a 100% short-term gain.
Many investors who this year believed in the widely held view that an approximate 80% loss in a technology share’s value can lead to a several hundred percent long-term gain, based on how many of these shares positively evolved in the years which followed the dot.com bubble in the year 2000, are still waiting on their positive returns, though.
One should also not forget that several of the dot.com companies such as Pets.com, Boo.com and Worldcom went bust and that the Nasdaq 100, after having lost 78% of its value by October 2002, wouldn’t reach its previous all-time high until April 2015!
 Source: ProRealTime
Large investors such as ARK Invest’s Cathie Wood apparently keep on believing in the leading crypto trading platform, as they feel that the company has a sound business model and retains long-term earnings potential despite it announcing last week that it needs to cut its workforce by nearly 20% amid rapidly falling cryptocurrency markets which have caused a notable slump in trading volumes.
Added to that Coinbase’s CEO, Brian Armstrong, last week stated that “we appear to be entering a recession after a 10+ year economic boom. A recession could lead to another crypto winter and could last for an extended period.”
The American cryptocurrency exchange platform also announced on Wednesday that it will no longer be offering its popular professional trading platform, Coinbase Pro, as it is restructuring services to bring them all into its one unified Coinbase platform called Advanced Trade.
This new platform was initially launched in March 2022 and provides traders in-depth analysis and actual trading directly on Coinbase. According to the company, Advanced Trade will provide the same volume-based fees as Coinbase Pro.
Are Coinbase shares slipping to a new all-time low?
As the price of Bitcoin (BTC) and Ethereum (ETH) fell by 6% and 8% respectively on Wednesday, Coinbase shares dropped by 7% as its rival Binance.US announced that it will introduce zero-fee trading for Bitcoin, potentially leading to a price war between the exchanges which may hurt their bottom line at a time of already lower trading volumes becoming the norm.
As is the case for many cryptocurrencies such as Bitcoin, Ethereum etc., Coinbase’s share price remains in a clearly defined downtrend with a series of lower highs and lower lows being visible on the daily chart.
 Source: ProRealTime
While the share remains below its late May high made around the $80 mark, a medium-term downtrend stays intact, with the below $50 mid-June low remaining in focus, a fall through which would engage the Coinbase all-time low at $40.83.
Potential psychological downside targets are round numbers such as the $40 mark or even $30 for the share. For any kind of hope of a bullish reversal to gain traction, a rise and daily chart close above this week’s high at around the $60 mark would need to be seen which should then take the Coinbase share price to above its late May high - above the $80 level. Only then would a minor bottom be formed.
Until this happens, the ‘trend is your friend’ and it keeps pointing down.


0 Comments
Recommended Comments
There are no comments to display.
Create an account or sign in to comment
You need to be a member in order to leave a comment
Create an account
Sign up for a new account in our community. It's easy!
Register a new accountSign in
Already have an account? Sign in here.
Sign In Now