Attempt for a relief rally continues but caution remains: S&P 500, Singapore Blue Chip, Brent crude

Entry posted by MongiIG in Market News
794 views
A late-night rally overnight saw US equity markets tapping on a fall in bond yields for some recovery, as markets continue its attempt to revert from oversold technical conditions to a more neutral territory.
 Source: Bloomberg
Market Recap
A late-night rally overnight saw US equity markets tapping on a fall in bond yields for some recovery, as markets continue its attempt to revert from oversold technical conditions to a more neutral territory. That said, the strong outperformance in defensive sectors yesterday (consumer staples +1.96%, healthcare +2.22%, utilities +2.35%) suggests that a cautious lean remains, with recession fears at the foreground as cyclical sectors fall out of favour (financials -0.46%, energy -3.75%, industrials -0.53%, materials -1.40%).
Economic data releases yesterday validated such concerns. Flash Purchasing Manager's Index (PMI) figures out of several developed economies came in lower-than-expected in both the manufacturing and services sector, which points to a broad-based moderation in economic activities. While the Fed’s stress test highlight the resilience of the US banking sector in weathering a severe recession and remove the risks of a wider bank-collapse scenario, the fact remains that there are room for economic conditions to normalise further in the coming year.
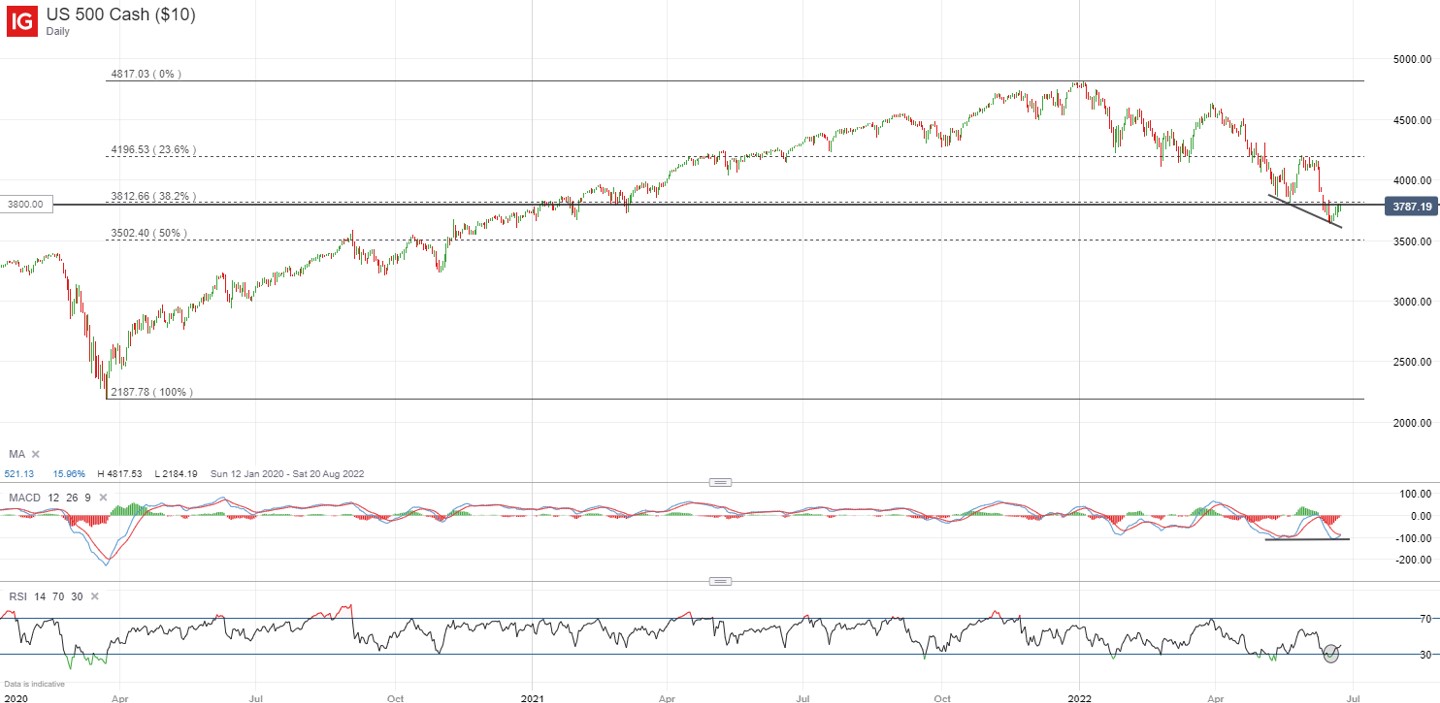
As mentioned yesterday, the iShares 7-10 Year Treasury Bond ETF (IEF) is seeking to bounce off a key support at its 2014 and 2018’s lows. With the fall in Treasury yields, markets may try to tap on some resilience in the rate-sensitive growth sectors for relief. That said, while the S&P 500 is attempting to recover from oversold conditions, the 3,800 level may have to be overcome to bring about greater confidence in a near-term recovery. This level marks the point where the post-Fed rally has fizzled off last week.
 Source: IG charts
Asia Open
Asian stocks look set for a mixed start, with Nikkei +0.22%, ASX -0.25% and KOSPI +0.58% at the time of writing. Risk appetite in the region may attempt to recover on some resilience in Wall Street overnight but some caution still largely lingers, heading into the weekend break and looking towards a key US inflation data release next week.
This morning’s release of Japan’s consumer price index (CPI) data saw its inflation rate coming in line with expectations at a 2.5% increase year-on-year (YoY), staying unchanged from April. The core inflation rate matched expectations of a 2.1% YoY increase as well. With the Bank of Japan (BOJ) continuing to defend its accommodative policies in the recent monetary meeting, the absence of any further uptick in pricing pressures may remove some pressure for the central bank to shift its policy stance for now. That said, this may have been largely priced into the USD/JPY for now and the key driver for the pair may revolve around moves in the US 10-year Treasury yields.
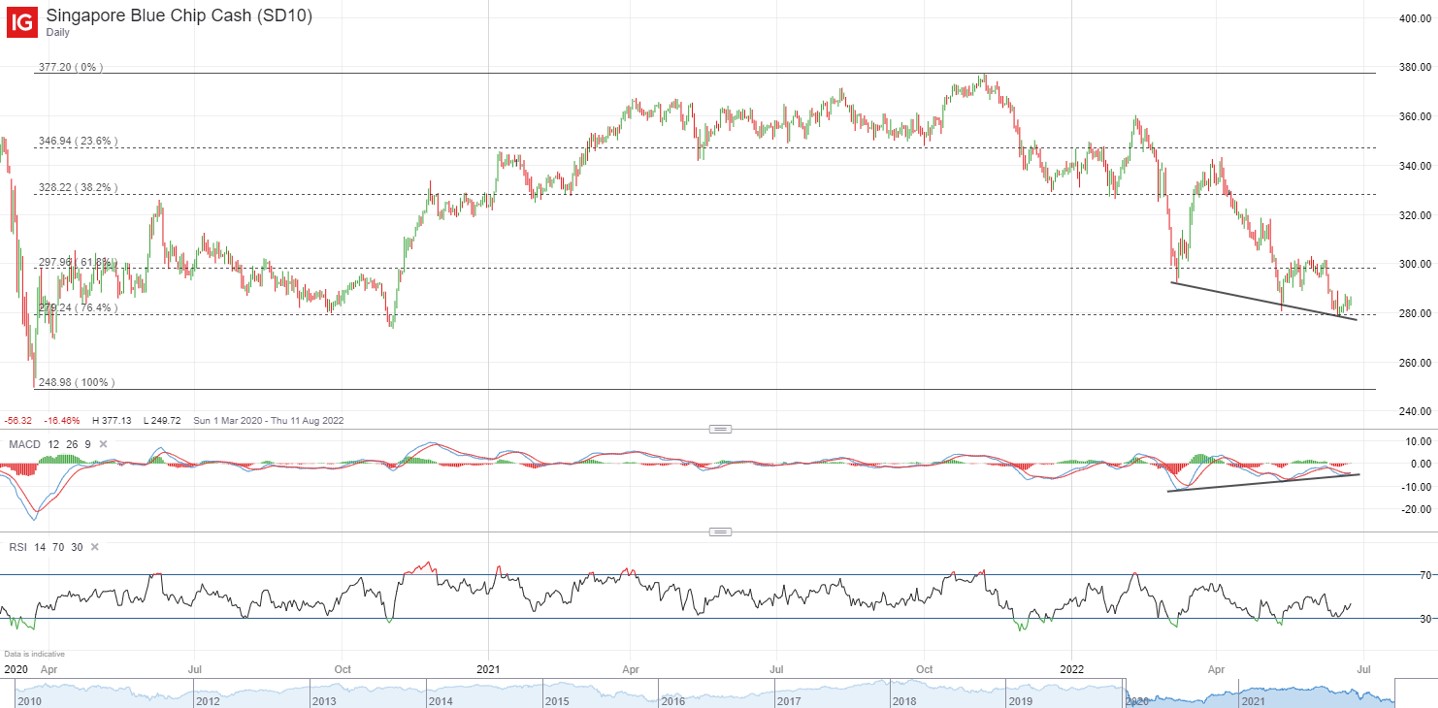
The day ahead has Singapore’s industrial production lined up in the economic calendar but risk appetite may take a greater cue from global market sentiments. For the Singapore Blue Chip Index, a bullish divergence on moving average convergence divergence (MACD) may increase the chances of a near-term recovery but the overall downward trend remains intact. Any relief may potentially bring a retest of the 300.00 level ahead and market participants may look out for any formation of a lower high.
 Source: IG charts
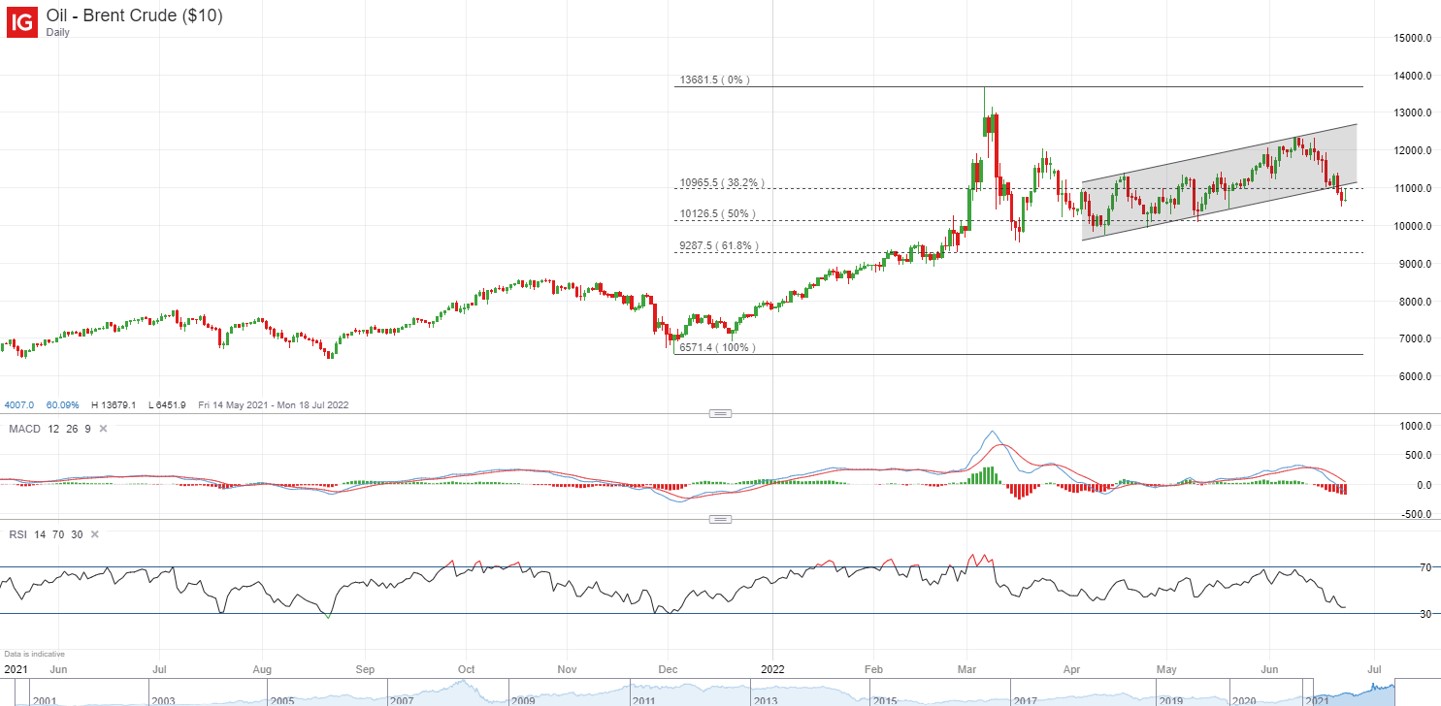
On the watchlist: Brent crude prices break below ascending channel pattern
Brent crude prices have broken below an ascending channel pattern in recent days, reinforcing the reversal in sentiments as market participants price for recession risks. An attempt to reclaim back above the channel pattern yesterday was met with a bearish rejection, as the US$110 level stood in the way as resistance. This is where a key 38.2% Fibonacci retracement level sits from its December 2021’s bottom to March 2022’s peak. Further downside may leave the US$100 psychological level on watch next.
 Source: IG charts
A look at the Energy Select Sector SPDR Fund also revealed the sector hitting its lowest level since April this year, coming at risk of breaking below a key support. For now, it may seem like the darling sector of S&P 500 is losing favour amid recession fears and a break of the 70.6 support may pave the way towards the 66.40 level next.
 Source: IG charts
Thursday: DJIA +0.64%; S&P 500 +0.95%; Nasdaq +1.62%, DAX -1.76%, FTSE -0.97%


.jpeg.98f0cfe51803b4af23bc6b06b29ba6ff.jpeg)


0 Comments
Recommended Comments
There are no comments to display.
Create an account or sign in to comment
You need to be a member in order to leave a comment
Create an account
Sign up for a new account in our community. It's easy!
Register a new accountSign in
Already have an account? Sign in here.
Sign In Now