S&P 500 pared some losses but sentiments remain fragile: Russell 2000, China A50, GBP/USD

Entry posted by MongiIG in Market News
717 views
Major US indices started the trading day sharply lower overnight, but dip buyers helped pare earlier losses to defend the 3,800 level for the S&P 500.
 Source: Bloomberg
Market Recap
Major US indices started the trading day sharply lower overnight, but dip buyers helped pare earlier losses to defend the 3,800 level for the S&P 500. That level marks a confluence of longer-term Fibonacci retracement levels displayed on the weekly chart, with buyers seen attempting to hold the line over the past three trading weeks. Headwinds surrounding inflation and growth continues to persist, with the US producer price index (PPI) surging way past expectations (11.3% year-on-year (YoY) versus 10.7% consensus) overnight, mirroring the likes of the recent US consumer price index (CPI) that more needs to be done to tame persistent pricing pressures. The US earnings season was also headed off to a downbeat start, with top and bottom-line misses for both JPMorgan and Morgan Stanley. JPMorgan temporarily suspended share buybacks, while investment-banking fees from both banks also underperformed expectations (down 54-55% from a year ago).
Within the gloom, buyers are attempting to seek for some pockets of optimism. Guidance for economic conditions from the major US banks point towards an impending slowdown, but it came with some downplaying of risks of a severe US recession with strength in consumer spending and labour market. Comments from hawkish Fed policymakers also came with a pushback against a 100 basis-point (bp) hike, with markets swiftly reversing course on their views as well.
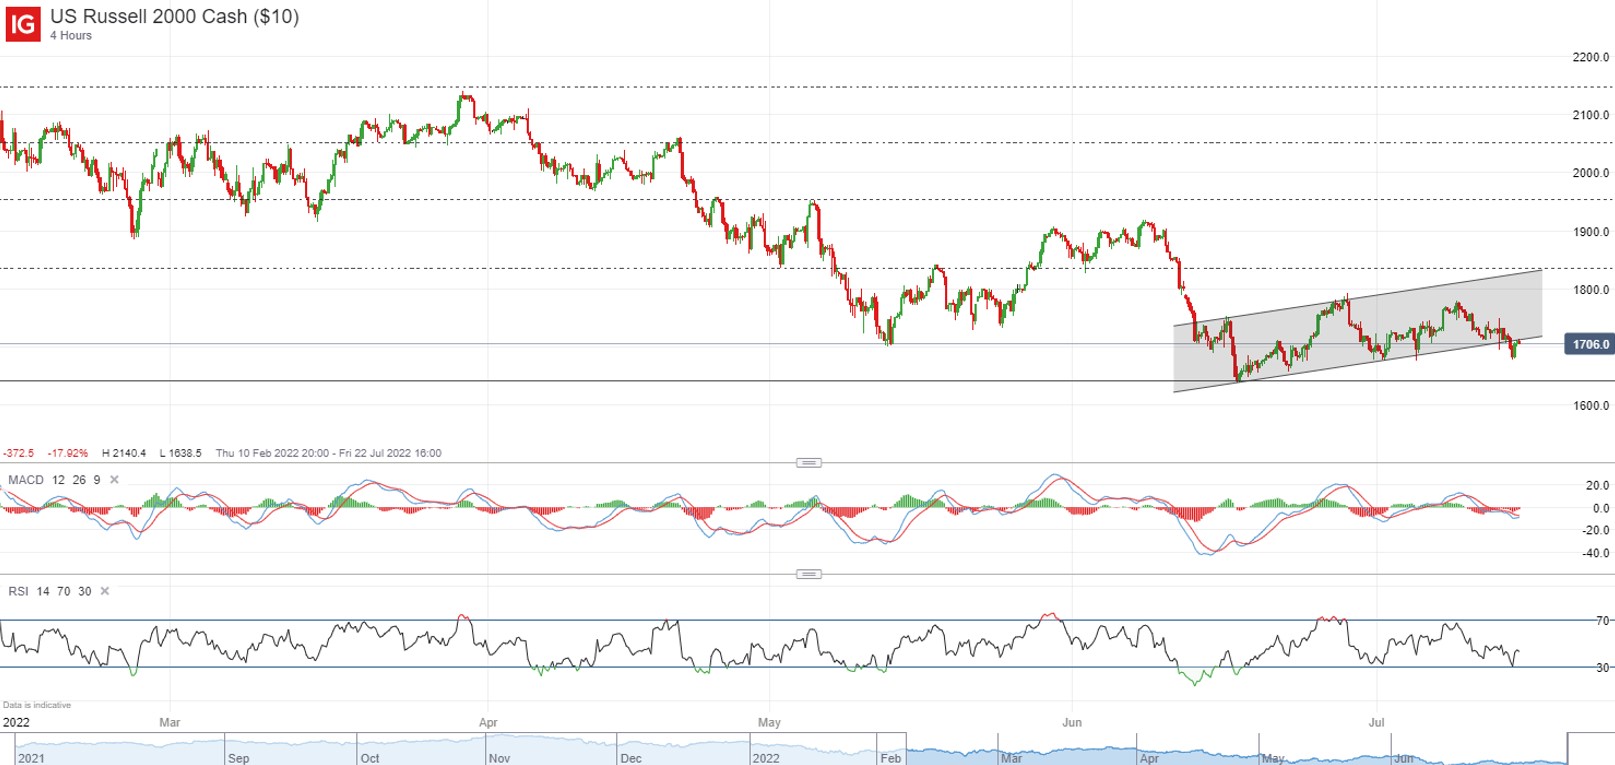
Overall, the S&P 500 has been trading within a consolidation zone over the past three weeks as a sign of some market indecision. While dip buyers are attempting to find their footing amid the economic headwinds, sentiments may remain fragile with earnings releases ahead running the risks of further misses and weak guidance. The Russell 2000 has broken below a near-term ascending channel pattern overnight, with the lower channel trendline likely serving as resistance to overcome ahead. This could leave any retest of the 1,640 level on watch next.
 Source: IG charts
Asia Open
Asian stocks look set for a weak open, with Nikkei -0.06%, ASX -1.54% and KOSPI -0.78% at the time of writing. The day ahead will bring about a series of data from China, namely the quarter two (Q2) gross domestic product (GDP), which is expected to reflect a sharp slowdown in economic activities amid virus restrictions. Any outperformance in the Q2 figure may point to a less pessimistic economic picture and provide some hopes of the economy not falling too far short of the 5.5% growth target laid out earlier this year. Activity data for June will be on watch as well, with retail sales expected to stay flat from a year ago, while industrial production may see further signs of pick-up to a 4.1% growth in June.
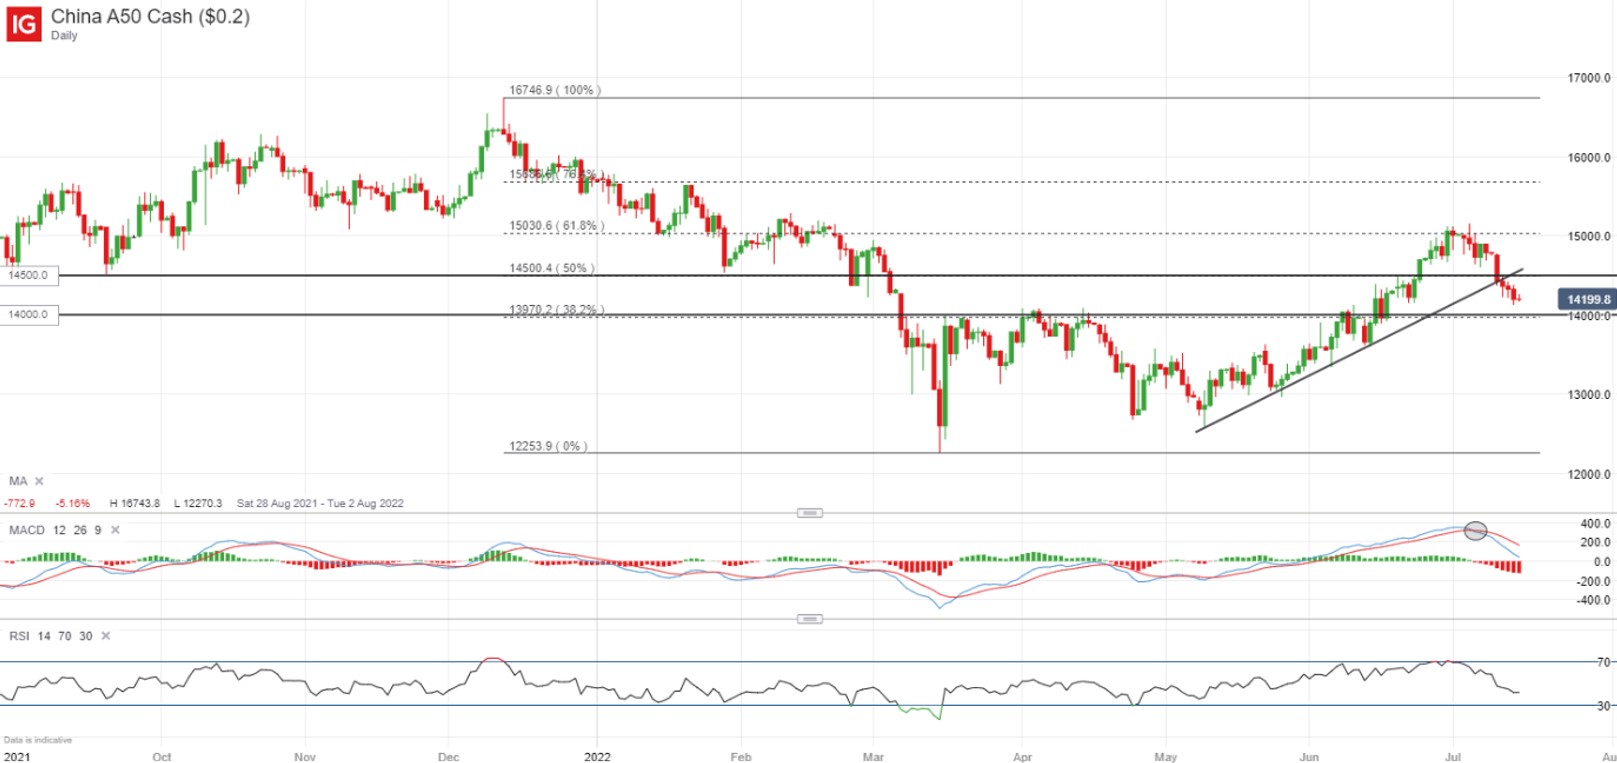
While the figures may reflect that the worst in economic conditions may be over for now, recovery ahead may seem more gradual and uneven, with the lingering risks of intermittent virus restrictions and new variants showing higher transmissibility. A ticking bomb also hangs at its housing market, with emergency meetings with banks being held by authorities after an increasing number of homebuyers refused to pay mortgages on stalled projects. This could increase the risks of default in loan repayments for banks and dampened confidence on its property market further. Chinese indices have pared down on their recent gains this week, with the China A50 breaking below a downward trendline, along with a bearish crossover on moving average convergence divergence (MACD). This could leave the key 14,000 level on watch next for a potential resistance-turned-support and any formation of a higher low.
 Source: IG charts
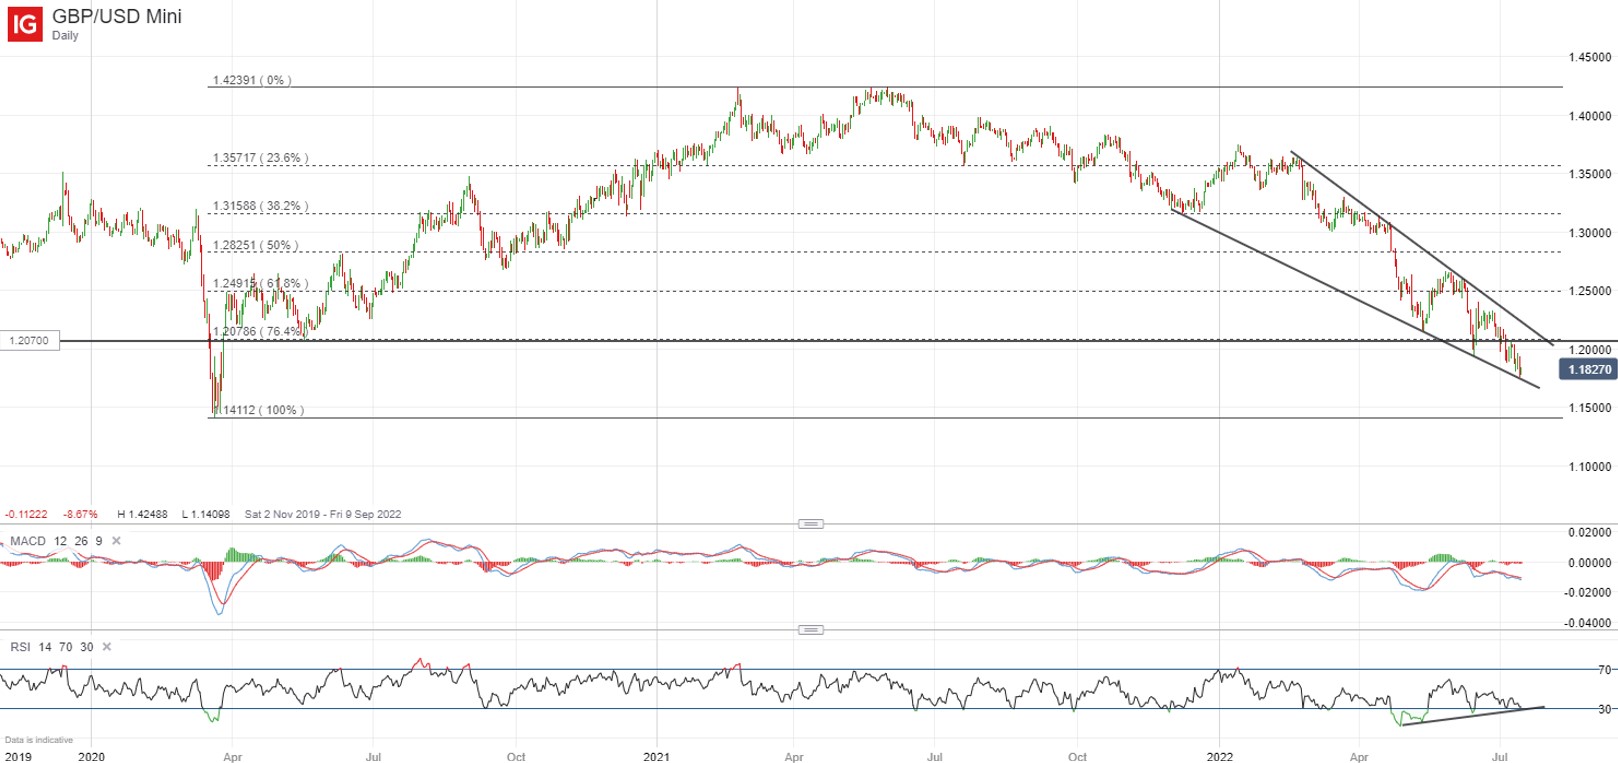
On the watchlist: GBP/USD retesting bottom trendline support of descending wedge pattern
A series of headwinds, ranging from the political crisis in UK, mounting recession concerns and US dollar strength, have led the GBP/USD to trade within a descending wedge pattern since the start of the year. The overall downward bias may remain but in the near-term, the currency pair is currently hovering around the bottom trendline support of the wedge. The trendline was seen to provide some temporary relief for the pair on two previous occasions. Any up-move from this current point may also drive the formation of a bullish divergence on the relative strength index (RSI), therefore increasing the chance of a bounce ahead. Resistance to watch may be at the 1.207 level, where it marks the confluence of a previous support-turned-resistance level in coincidence with a key 76.4% Fibonacci level.
 Source: IG charts
Thursday: DJIA -0.46%; S&P 500 -0.30%; Nasdaq +0.03%, DAX -1.86%, FTSE -1.63%


0 Comments
Recommended Comments
There are no comments to display.
Create an account or sign in to comment
You need to be a member in order to leave a comment
Create an account
Sign up for a new account in our community. It's easy!
Register a new accountSign in
Already have an account? Sign in here.
Sign In Now