Jump to content

BHP earnings preview: will results help reverse the recent downtrend?


ArvinIG

972 views

Investors are keen to glimpse the outlook from BHP’s upcoming annual report after rival Rio Tinto disappointed investors due to heightened uncertainties.

1660529664790.jpg
Source: Bloomberg


ASX: BHP release date

BHP Group Limited (ASX) is expected to release its earnings report on Tuesday, August 16, 2022.

Expectation:

  • NPAT: US$ 16.4B
  • EPS: 5.935 (48% up from FY21)
  • DPS:4.49 (25% yearly increase)

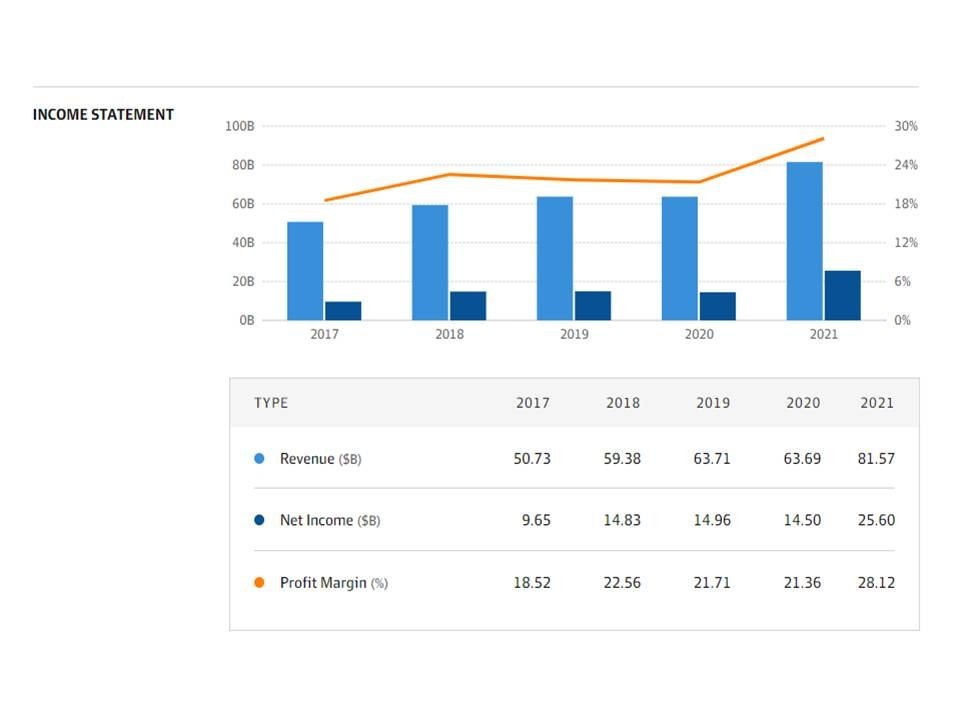
BHP earnings key watch:

The markets are anticipating that BHP will report an underlying net profit of US$20.4 billion, up 19.3% on the year in 2021. During the first half of the financial year, BHP announced a jaw-dropping margin of 64% thanks in part to higher iron ore, copper, coal, and nickel prices and “near record production at Western Australia Iron Ore (WAIO).”

The operations profit was recorded at US $14.8 billion, an increase of 50% from the same quarter in the previous financial year.

1660529664871.JPG
Source: BHP

BHP’s mining exports broke records during the first quarter of 2022 due to the invasion of Ukraine by Russia. By April, the company’s commodity prices had lost steam as the price of iron ore fell 35% and copper fell 25%. It is expected that the fluctuation in prices will impact BHP’s earnings results.

Starting from the second quarter of the year, rising interest rates and the prospect of a recession have weighed heavily on the commodity outlook. This was recently seen when Rio Tinto, BHP’s major rival, declared it would be discounting its dividend pay-out due to an uncertain future ahead. It is due to this reason that BHP investors are keen to get a glimpse of the future outlook from the impending report.


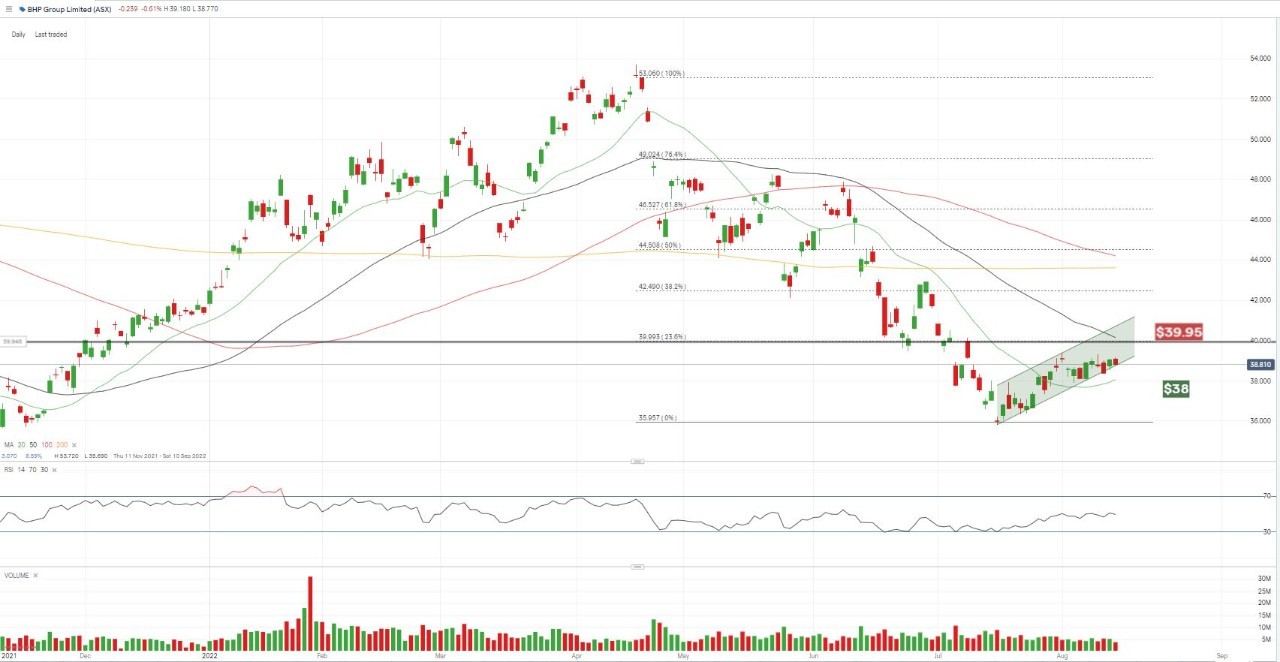
Share price and technical analysis:

BHP’s share price has fallen from the April double top of $47.90 to around $37 in August, losing more than 25% of its value in three months. The break of support at $40.00/$39.00 leaves the share price vulnerable to a retest of the July $35.85 low.

Looking ahead, the price may test the level of $39.95 first (23.6% retracement from the April peak) as it defends the opening range for August, with a move above the 50-day SMA (around $40) bringing the July high to $42 on the radar. On the other hand, the price may find temporary support from the level of $38 if breaching through the moving trajectory.

BHP daily chart

1660529664892.JPG
Source: IG

Hebe Chen | Market Analyst, Melbourne
15 August 2022

0 Comments


Recommended Comments

There are no comments to display.

Create an account or sign in to comment

You need to be a member in order to leave a comment

Create an account

Sign up for a new account in our community. It's easy!

Register a new account

Sign in

Already have an account? Sign in here.

Sign In Now
  • Blog Statistics

    • Total Blogs
      3
    • Total Entries
      2,822
  • Latest Forum Topics

  • Our picks

    • International Workers' Day & Early May Trading Hours
      Please be advised that our opening hours will be adjusted on 1 May 2024 for International Workers’ Day and 6 May 2024 for the UK Early May Bank Holiday. Where appropriate, the times listed are in GMT.
    • Are these the best AI stocks to watch in May 2024?
      Microsoft, Apple, Nvidia, Amazon and Meta could be the best AI stocks to watch next month. These stocks are the largest AI stocks in the US based on market capitalisation.
    • Natural Gas Commodity Elliottwave Technical Analysis
      Natural Gas


      Mode - Impulsive 


      Structure - Impulse Wave 


      Position - Wave (iii) of 5


      Direction - Wave (iii) of 5 still in play


      Details:  Price now in wave iii as it attempts to breach 1.65 wave i low. Wave (iii) is still expected to extend lower in an impulse.


      Natural Gas is currently breaching the previous April low, marking a decisive move as the impulse initiated on 5th March continues its downward trajectory, further extending the overarching impulse wave sequence that commenced back in August 2022. This decline is anticipated to persist as long as the price remains below the critical resistance level of 2.012.


      Zooming in on the daily chart, we observe the medium-term impulse wave originating from August 2022, which is persisting in its downward trend after completing its 4th wave - delineated as primary wave 4 in blue (circled) - at 3.666 in October 2023. Presently, the 5th wave, identified as primary blue wave 5, is underway, manifesting as an impulse at the intermediate degree in red. It is envisaged that the price will breach the February 2024 low of 1.533 as wave 5 of (3) seeks culmination before an anticipated rebound in wave (4). This confluence of price movements underscores the bearish sentiment prevailing over Natural Gas in the medium term.


      Analyzing the H4 chart, we initiated the impulse wave count for wave (3) from the level of 2.012, which marks the termination point of wave 4. Notably, price action formed a 1-2-1-2 structure, with confirmation established at 1.65 and invalidation set at 2.012. The confirmation of our anticipated direction materialized as price breached the 1.65 mark, signifying a resumption of bearish momentum. Presently, there appears to be minimal resistance hindering the bears, thereby reinstating their dominance in the market. It is projected that wave iii of (iii) of 5 will manifest around 1.43, indicative of the potential for the wave 5 low to extend to 1.3 or even lower. This comprehensive analysis underscores the prevailing bearish outlook for Natural Gas in the immediate future.


      Technical Analyst : Sanmi Adeagbo
       
        • Like
×
×
  • Create New...
us