Banking on it: Breaking down the Big Four

Entry posted by ArvinIG in Analyst article
657 views
As we roll to the end of Aussie earnings season, we look at Big Four banks.
The Australian earnings season is all but done. For the most part, it proved a solid reporting period for corporates, belying some of the pessimism market participants had coming into results. As always, the banking sector was under the microscope, with the Commonwealth Bank of Australia delivering its full year results, and the NAB delivering a quarterly update. So, what did we learn about the sector and the Australian economy? In this article, we go through the fundamentals and outlook for Aussie banks and weigh up whether it’s a good time to buy the sector.
Margins are squeezed and an uncertain outlook
We are in a rising interest rate environment but for the major banks, the benefits haven’t flowed through to net interest margins yet. Both the CBA and NAB reported a sizable drop in margins for the reporting period, with a rock-bottom cash rate squeezing net interest margins. Management from each bank talked up the outlook for margins going forward, as the benefits of RBA hikes and increases to standard variable mortgage rates, not to mention a slow pass-through of rate hikes to depositors – take effect.
The outlook for the Australian economy was somewhat mixed, however. CBA CEO Matt Comyn spoke of the ‘challenging time’ the economy faces but said that the bank is optimistic that ‘a path can be found to navigate through these economic conditions’ and that the ‘medium-term outlook for Australia is a positive one’. NAB CEO Ross McEwan proved more sanguine in his company’s update, expressing confidence that low unemployment and healthy business and household balance sheets will mitigate the impacts of inflation and higher interest rates.

Source: Bloomberg
-
CBA
As the only company to lodge official results, most of the focus this reporting season was on the CBA’s FY22 earnings.
The bank’s results proved stronger than analysts had expected, with the bank handing down full-year results showing a $24.9 billion topline, and net income of $9.96 billion. The final dividend was $2.10 taking the full-year dividend to $3.85.
The record result came despite the squeeze in margins. The net interest margin dropped 18 points to 1.90%, ‘due to a large increase in low yielding liquid assets and lower home loan margins. CBA said it expects margins to increase in a rising interest rate environment.
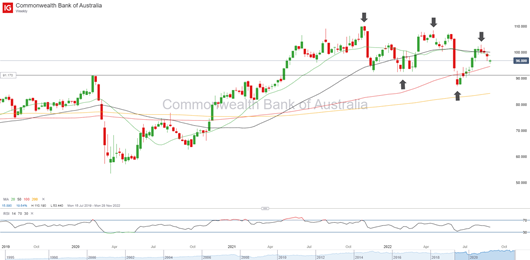
The share price response was soggy following the FY22 numbers. Investors appeared to hook onto the cloudy outlook for the bank, as concerns build about a weaker economic environment that may impact house prices and credit growth.
Analysts have become increasingly bearish on CBA stock, with consensus favouring a sell rating, according to data compiled by Reuters. The current price target is $US91.29.
A look at the charts suggests slowing upside momentum for CBA shares, with the price carving out a series of lower-highs. As the stock slips back below $100 per share, the next buy zone looks to be around support at $90. The 200 WMA, currently around $85, will be a significant level of support.
Source: IG
-
NAB
NAB’s quarterly update showed modest strength for the bank over the course of the 3rd quarter. Unaudited cash earnings were $1.8 billion for the quarter, marking a 3% increase compared to the 1H22 quarterly average.
Net interest margins declined slightly for the period but excluding markets and treasury it was higher. NAB management also flagged a pick-up in margins courtesy of a higher interest rate environment.
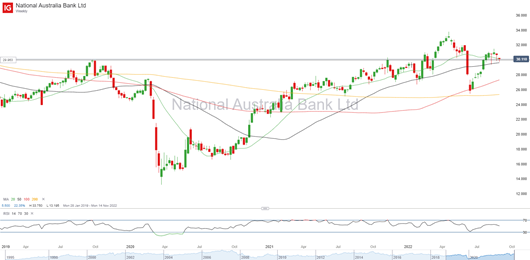
The analyst community is mixed on the outlook for NAB stock. The consensus recommendation is a hold from 15 brokers, with eight suggesting that course of action, but six suggesting either a buy or strong buy. The consensus price target is at a premium to the current share price of $31.19.
The charts convey a similar loss of upside momentum for NAB’s shares, with sellers taking control of the price above $30 per share. The stock is finding some support above the 20-week MA, with a key level of resistance around the 50-week MA.
Source: IG
-
WBC
There were no results reported from Westpac this earnings season. The bank will hand down its full-year earnings on the 7th of November.
At this stage, Reuters data suggests analysts are expecting profits of $5.4 billion, roughly flat on the previous year, and a slight increase in the dividend to $1.21.
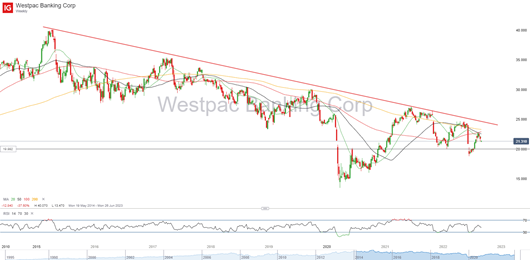
Analysts are mixed on Westpac shares, with the consensus rating a hold. However, the share price trades significantly below the consensus price target, which is $24.06.
Technically speaking, WBC shares are in a long-term downtrend, with the stock looking as weak as any of the Big Four on the charts right now. Price remains below all key weekly moving averages, and the RSI shows bearish price momentum. $20 is a major level of technical support.
Source: IG
-
ANZ
ANZ didn’t deliver an update this quarter, with the bank set to report its full-year results on the 27th of October.
Analysts are forecasting an increase in revenues for FY22, but a slight drop in profits for the year from the ANZ to $6.27b. The bank is tipped to lift its full-year dividend to $1.42.
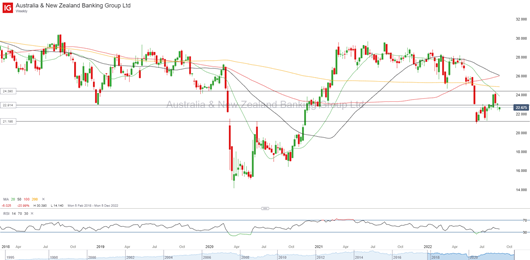
Amongst analysts, the ANZ possesses a hold rating, but a price target well above the current market price at $25.43.
From a technical standpoint, ANZ shares are marked by downward momentum, with the weekly RSI below 50 and price below the 20, 50, 100 and 200-day moving averages. Significant resistance appears to be around $24.40 while support can be found at $21.20.
 Source: IG
Summary
Despite the obvious benefits that ought to flow through to the banks from higher interest rates and larger net interest margins, the outlook for bank shares remains uncertain. Slowing growth, higher inflation, and those higher interest rates pose a risk to profits and dividends, with bank management casting concerns over the short-term outlook.
The investment case would appear mixed for bank stocks right now. Analysts are relatively bearish, advocating for ‘holds’ or ‘sells’ even as the likes of Westpac and the ANZ are trading at significant discounts to consensus price targets. The charts are showing a general lack of momentum, signalling that buying banks here offer an unattractive risk/reward.
Kyle Rodda | Market Analyst, Australia
31 August 2022


0 Comments
Recommended Comments
There are no comments to display.
Create an account or sign in to comment
You need to be a member in order to leave a comment
Create an account
Sign up for a new account in our community. It's easy!
Register a new accountSign in
Already have an account? Sign in here.
Sign In Now