Australian dollar outlook: Fed knights US dollar king of the world

Entry posted by ArvinIG in Analyst Article
1,516 views
The Australian dollar may have to deal with a relatively dovish RBA; unterest rate differentials and commodities are working against the Aussie and if the Fed kicks in a jumbo hike this week, will AUD/USD go lower?

Source: Bloomberg
The Australian dollar appears captive to US dollar gyrations for now. US dollar movements look to be driven by Treasury yields. Treasury yields seem to be driven by the actions of the US Federal Reserve.
So, to understand where the Aussie dollar might be headed, it could be worthwhile to have a grasp of what the Fed is up to.
While the RBA is copping flak for increasing interest rates 225 basis points (bp) from the pandemic low, their US counterpart has lifted their cash rate by the same amount. The key difference is rhetoric about rates going forward.
On Friday, RBA Governor Philip Lowe reiterated his opinion that as rates become elevated, the case for further large boosts decreases.
He stated that the RBA will be considering a hike of either 25 or 50 bp at their next meeting on 4th October. The tightening of monetary policy is to calm a rising tide of inflation. The last read of year-on-year CPI to the end of the second quarter came in at 6.1%.
On the other side of the Pacific Ocean, Fed Chair Jerome Powell is facing choppier waters. Headline inflation there is at 8.3% year-on-year to the end of August, and he has made it clear that the central bank will continue to tighten aggressively.
The reaction by markets to the release of US CPI illustrates the importance of the Fed’s policy for global markets.
AUD/USD reactions to data
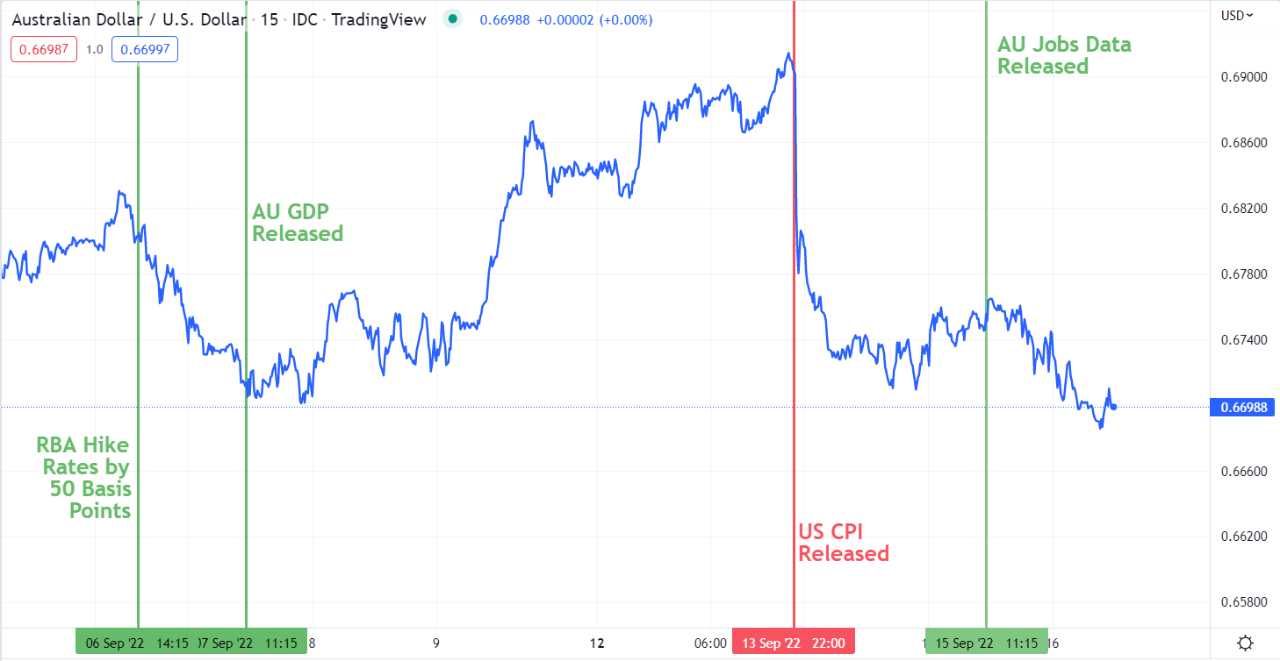
Source: TradingView
A Bloomberg survey of economists is forecasting a 75 bp hike at the Federal Open Market Committee (FOMC) meeting this Wednesday. The market has fully priced this in and has an off chance of 100 bp.
With short-end rates tilting north, this has moved out and along the respective government yield curves.
Looking at the spread between Treasury and Australian Commonwealth Government Bond (ACGB) yields in the 2- and 10-year part of the curve, the increase in correlation is observable over the last few months.
AUD/USD against 2- and 10-year bond spreads
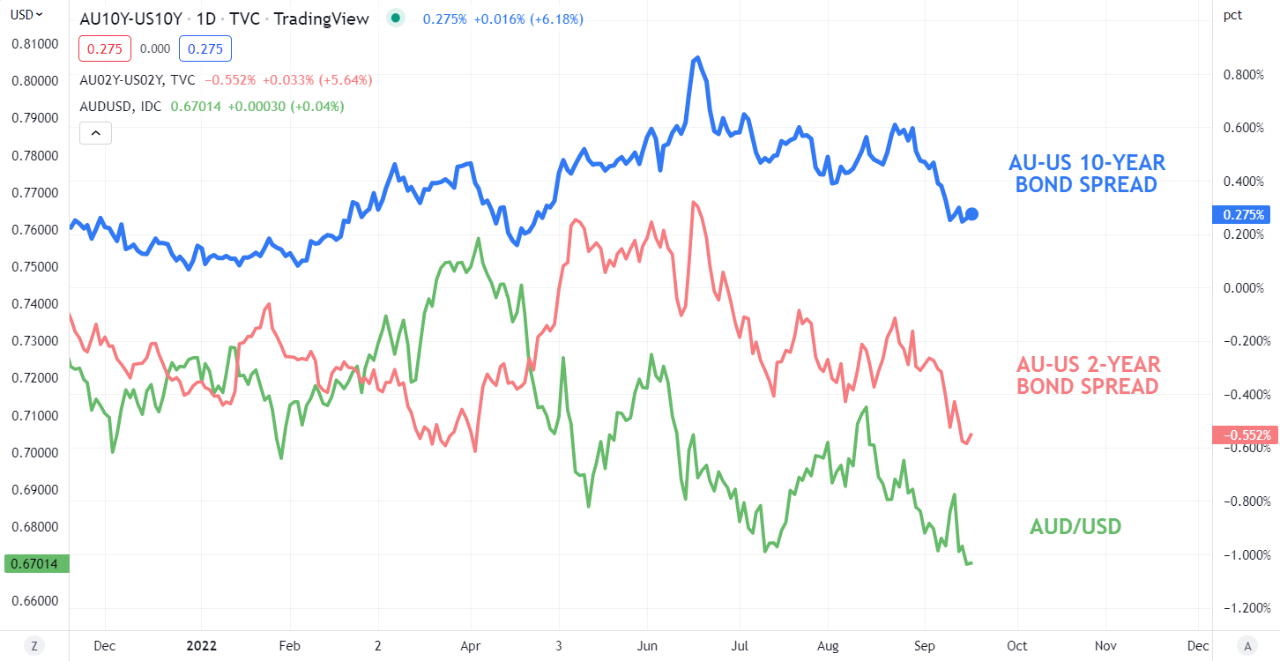
Source: TradingView
While all of this is playing out, the fundamental backdrop for the Australian dollar remains strong, as shown by jobs data released last week. While the August unemployment rate nudged higher to 3.5% against the 3.4% forecast and prior reading, it is still near multi-generational lows.
The overall change in employment for the month was 33.5k instead of 35k anticipated. Full-time employment increased by 58.8k, while 25.3k part-time jobs were lost in August.
The participation rate printed as expected at 66.6% but higher than 66.4% previously. This data is on top of healthy GDP and trade numbers from the prior week.
Commodity prices have been volatile and have softened with a stronger US dollar. The market perception is that global tightening of policy will eventually lead to a slowdown in growth and less demand for raw materials.
The prospect of a slowdown in economic activity has seen equity markets take a bath and the ASX 200 is not immune. In a risk-off environment, the growth and commodity-linked Aussie is vulnerable.
The Fed decision is on Wednesday and it is shaping to be a crucial data point for AUD/USD.
AUD/USD against copper, ASX 200, iron ore, and gold
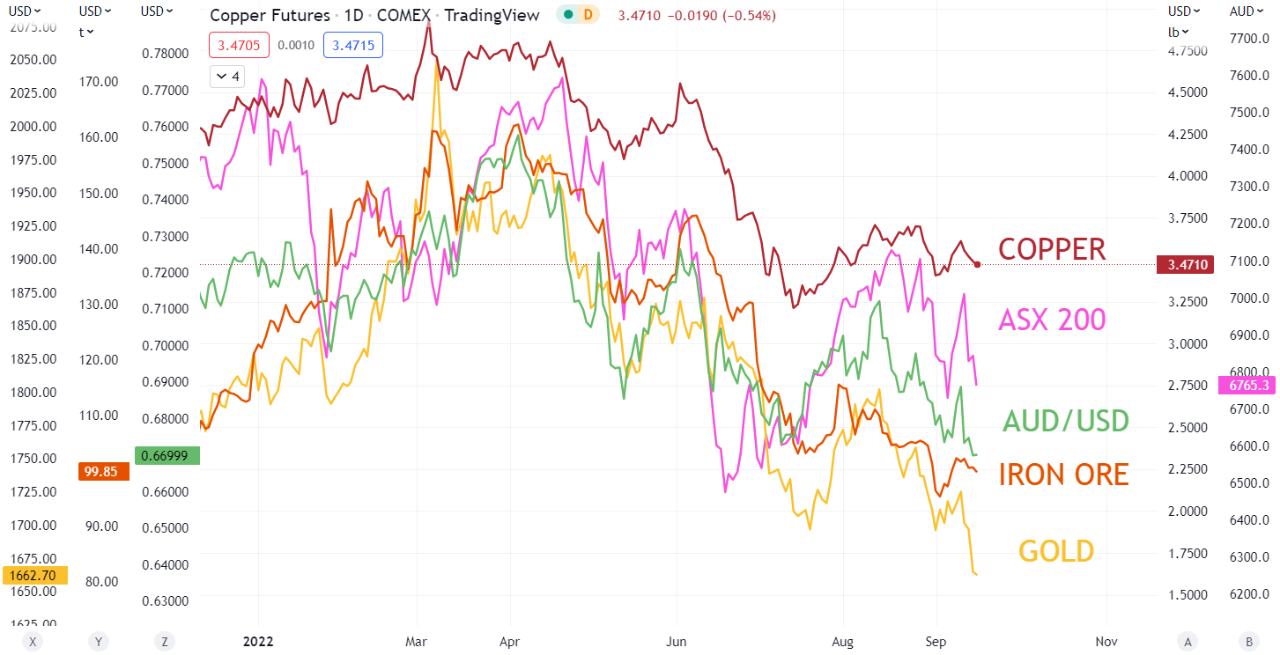
Source: TradingView
This information has been prepared by DailyFX, the partner site of IG offering leading forex news and analysis. In addition to the disclaimer below, the material on this page does not contain a record of our trading prices, or an offer of, or solicitation for, a transaction in any financial instrument. IG accepts no responsibility for any use that may be made of these comments and for any consequences that result. No representation or warranty is given as to the accuracy or completeness of this information. Consequently any person acting on it does so entirely at their own risk. Any research provided does not have regard to the specific investment objectives, financial situation and needs of any specific person who may receive it. It has not been prepared in accordance with legal requirements designed to promote the independence of investment research and as such is considered to be a marketing communication. Although we are not specifically constrained from dealing ahead of our recommendations we do not seek to take advantage of them before they are provided to our clients.


0 Comments
Recommended Comments
There are no comments to display.
Create an account or sign in to comment
You need to be a member in order to leave a comment
Create an account
Sign up for a new account in our community. It's easy!
Register a new accountSign in
Already have an account? Sign in here.
Sign In Now