Further tightening from MAS, with an avoidance of a technical recession. What’s next?

Entry posted by MongiIG in Market News
549 views
Singapore avoided a technical recession, with the MAS adopting its fifth round of tightening move. What can we expect ahead for the USD/SGD?
 Source: Bloomberg
Some relief on avoidance of technical recession…
The advance estimate for Singapore’s third quarter (Q3) gross domestic product (GDP) have provided a heave of relief at first sight, with its 1.5% quarter-on-quarter (QoQ) growth delivering a pushback of a technical recession after previous quarter’s 0.2% contraction. Year-on-year (YoY), GDP growth rate grew by 4.4%, towering above the 3.4% forecast. Pockets of strength in the services and construction sector accounted for the outperformance, potentially as a follow-through impact from abating Covid-19 risks and ongoing reopening. The resilience aided to more than offset the ongoing contraction in the manufacturing sector, which saw a 3.3% decline from the previous quarter.
…but too early to cheer with challenging outlook ahead
That said, the economic outlook remains downbeat, with more persistent inflation and ‘intensified’ downside risks to growth being highlighted by the Monetary Authority of Singapore (MAS). Singapore’s GDP growth is guided to come in below trend in 2023, suggesting that the current economic strength being presented may not be sustainable. Softening sentiments may kick in to moderate consumer spending, while growth slowdown in Singapore’s major trading partners on persistent cost pressures and tighter financial conditions could dent external demand. Overall, the outlook remains a cloud of uncertainty, suggesting that current economic strength could be short-lived.
MAS’ single tightening move a ‘dovish’ surprise but more tightening on the table
Latest update also saw the MAS delivering its fifth tightening move over the past one year, with the re-centring of the mid-point of the Singapore Dollar Nominal Effective Exchange Rate (S$NEER) policy band. There were no changes to the slope and width of the band. Tightening in the current meeting has been widely expected, with its August inflation showing no signs of peaking, along with the more hawkish build-up in US Federal Reserve (Fed) interest rate expectations. What is more surprising could be the absence of a ‘double-barrelled’ move, which could be perceived as a ‘dovish’ and less-aggressive approach to what some may expect.
However, this should not be taken as a sign that the tightening process is easing, considering that the inflation forecasts clearly pointed to more persistence and revealed a higher-for-longer backdrop. Core inflation is expected to slow only in second half (2H) of 2023, seemingly a backward shift in timeline as previously guided. Despite seeing four rounds of tightening over the past one year (current one being the fifth), the upside risks to inflation are still presented in the projections, with core inflation expected to come in at 3.5–4.5% on average in 2023. Headline inflation through 2023 is expected to come in at 5.5-6.5%, still far above the central bank’s target.
That may leave further tightening on the table in the April and October 2023 meetings, or even the possibility of off-cycle tightening moves next year. The recent more measured move could be a temporary breather, coming after the aggressive pace of tightening over the past one year (with two off-cycle moves in 2022).
USD/SGD on track to complete a double-top pattern. Can it break below the neckline?
Despite the ‘dovish’ surprise in recent policy move, the USD/SGD has seen a sharp move lower as the more persistent inflation forecast clearly points towards little room for easing in terms of policies. The pair seems on track to complete a double top pattern. Any break below the 1.420 neckline level will be crucial to watch, which could bring about further downside to the 1.407 level next, where a key 61.8% Fibonacci retracement level stands. That said, despite previous MAS’ tightening moves thus far, the USD/SGD remains firmly rooted on an upward trend, considering that the central bank could still be deemed to be largely playing catch-up with the Fed’s policies. This will leave the formation of any new higher low on watch as a continuation of the longer-term upward trend.
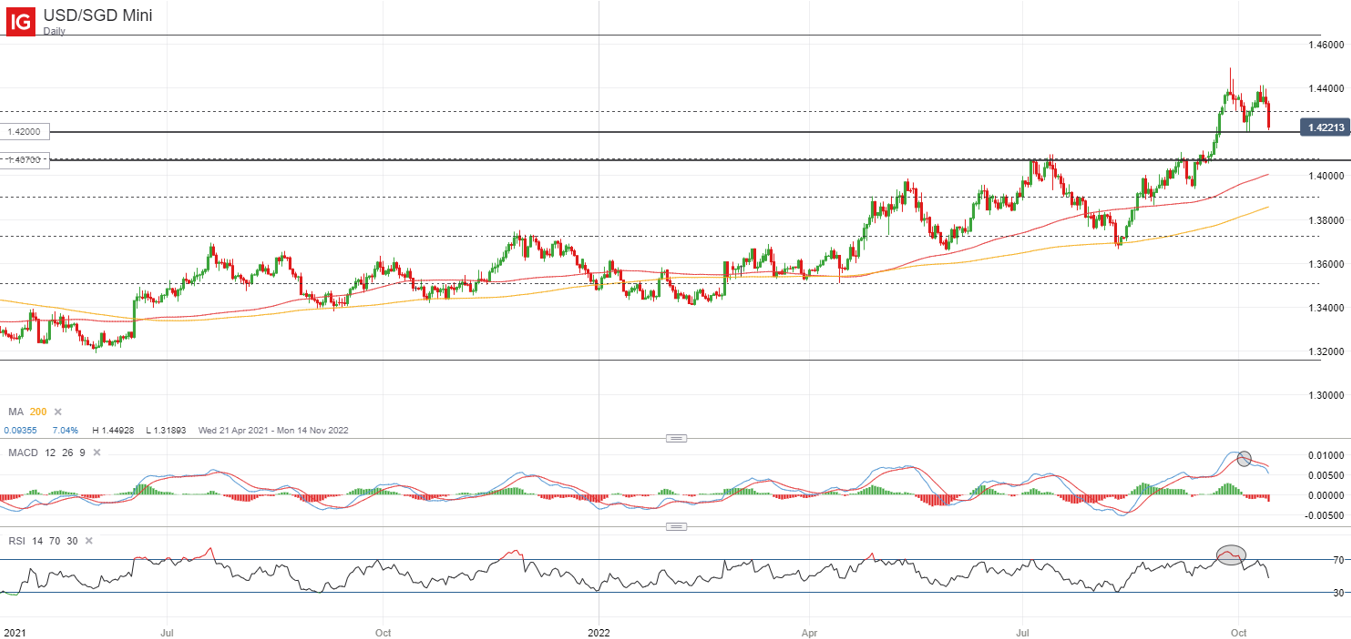 Source: IG charts


.jpeg.98f0cfe51803b4af23bc6b06b29ba6ff.jpeg)


0 Comments
Recommended Comments
There are no comments to display.
Create an account or sign in to comment
You need to be a member in order to leave a comment
Create an account
Sign up for a new account in our community. It's easy!
Register a new accountSign in
Already have an account? Sign in here.
Sign In Now