Can Microsoft deliver a relief rally with its upcoming Q1 earnings?
With the global moderation in economic conditions, all of Microsoft’s business segments are expected to face further slowdown for the upcoming earnings release. But has much been priced for now?
 Source: Bloomberg
When does Microsoft Corp report earnings?
Microsoft Corp is set to release its quarter one (Q1) financial results on 25 October 2022, after market closes.
Microsoft’s earnings – what to expect
Current market expectations are for Microsoft’s upcoming Q1 revenue to come in at $49.8 billion, up 9.9% year-on-year (YoY). This will mark the fifth consecutive quarter of revenue slowdown and the slowest year-on-year growth since June 2017. Earnings per share are expected to come in at $2.32, just a mere 2% increase from a year ago.
Further growth slowdown expected for all business segments
In line with the global moderation in economic conditions, all of Microsoft’s business segments are expected to face a further slowdown in their year-on-year growth. Perhaps the more appalling detail is that its personal computing segment, which accounted for around 28% of total revenue, is expected to see revenue contract slightly by 0.5% from a year ago. For the tech darling in which investors’ questions have always been about how much growth it can deliver, talks of a contraction in one of its business segments seem to provide testament to the heavy headwinds for the economic outlook ahead. The projection is not totally surprising, considering that recent statistics points to the global PC market witnessing its steepest decline in the last two decades during the September quarter. On the other hand, its ‘productivity and businesses processes’ are expected to slow to the single-digit of 7.8%, for the first time in two years. But at least one may find relief that the weakness could have been priced, leaving any resilience on that front to push back against the extreme bearish sentiments.
Intelligent cloud segment expected to do the heavy-lifting
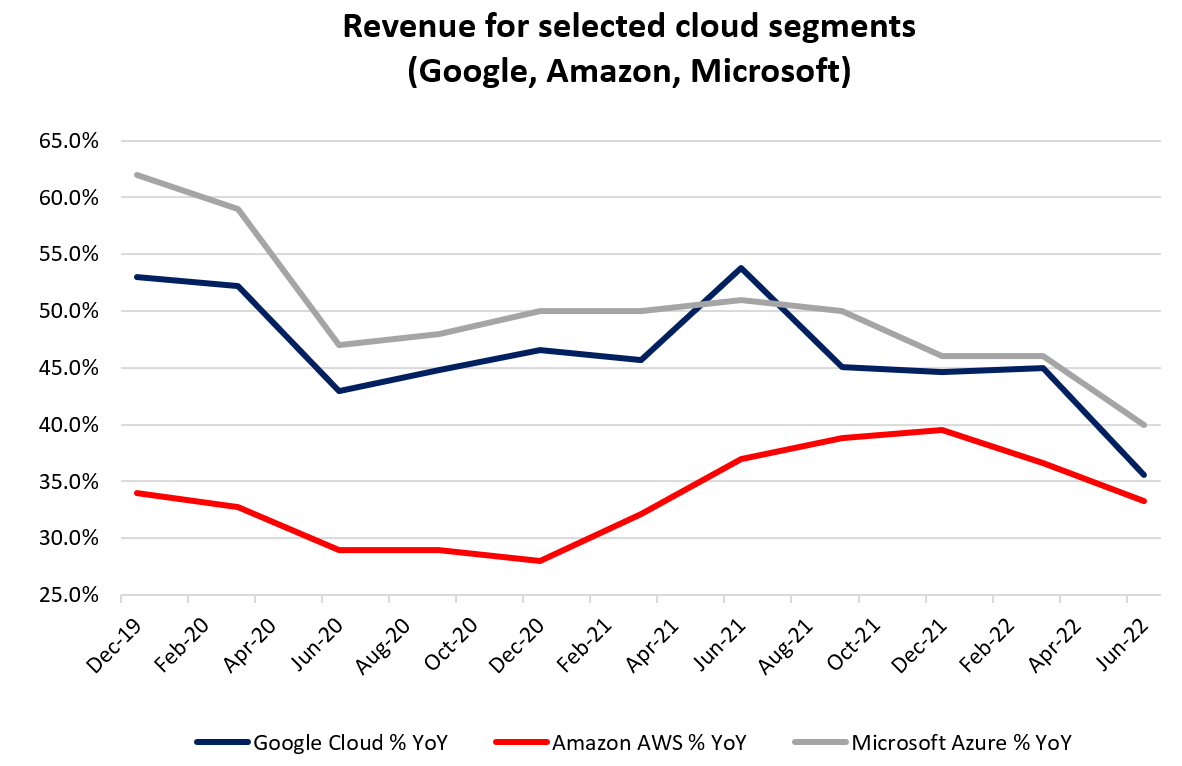
Its crown jewel in focus will undoubtedly be the intelligent cloud segment, which is its highest-growth business and takes up 40% overall revenue. Growth is expected to slow as well, but remains at an elevated level of 20.3%. For now, growth for Microsoft’s Azure has consistently outperformed its competitors, mainly due to its smaller market size. Nevertheless, this suggests that its cloud services are continuing to gain traction. Previous quarter’s results continued to point towards strong momentum with a 25% increase in commercial bookings, so some resilience could still be presented this time round. The key question will fall on the company’s outlook. Markets are pricing for only a negligible decline in growth for its ‘intelligent cloud’ segment through 2023, so there may be risks of a negative surprise in the event its crown-jewel business also fail to hold up.
 Source: Alphabet Inc, Amazon Inc, Microsoft Corp
Valuation – After falling close to 30% year-to-date, has much been priced in for now?
The global equity sell-off since the start of this year has indeed brought about some moderation in equity valuation, from previous overbought levels to more fair conditions. While forward price-to-earnings (P/E) estimates may carry a higher amount of uncertainty amid the current economic outlook, taking it as a reference suggests that Microsoft’s valuation is trading almost back at its 10-year median. While this may seem ‘cheap’ to some dip buyers, a comparison with its peers will reveal that markets are pricing that its peers will be having a tougher time ahead (except Apple). Expectations heading into the earnings season could have been low to begin with, leaving a relatively low watermark for corporates to beat before the full effect of tightening kicks in. This may leave any earnings resilience on the cards for Microsoft to tap on for a relief rally, as what we have seen in the previous quarter’s earnings season.
 Source: Nasdaq
Technical analysis – Can the bullish divergence drive a near-term rebound?
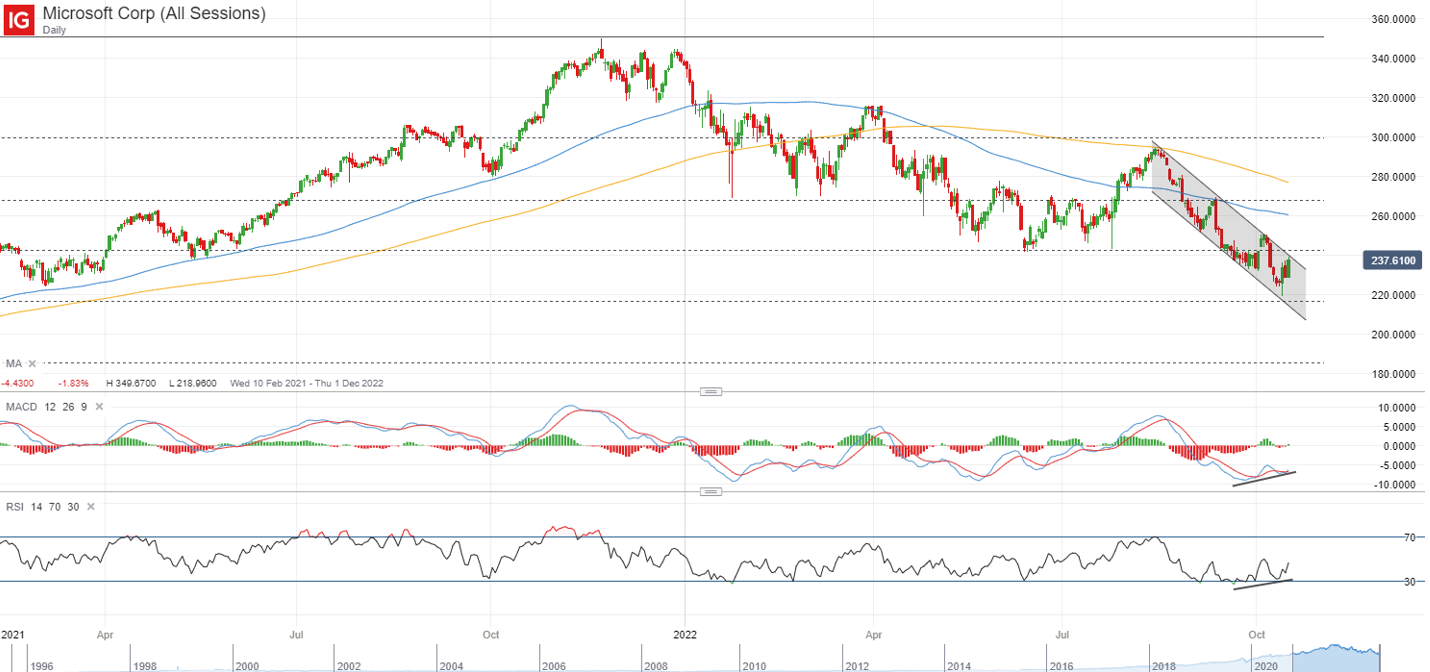
Microsoft’s share price has been trading in a descending channel pattern since August this year, with the series of lower highs and lower lows suggesting that a longer-term downward trend remains in place. That said, recent lower price lows were met with higher lows on both the moving average convergence/divergence (MACD) and relative strength index (RSI), with the bullish divergence suggesting that a near-term rebound could be on the cards. Ahead, the US$243.60 level will be a key resistance to overcome, where the upper channel trendline resistance coincides with a key 50% Fibonacci retracement. In the event that a breakout fails to materialise, trading within the channel will leave the US$217 level on watch.
 Source: IG Charts


0 Comments
Recommended Comments
There are no comments to display.
Create an account or sign in to comment
You need to be a member in order to leave a comment
Create an account
Sign up for a new account in our community. It's easy!
Register a new accountSign in
Already have an account? Sign in here.
Sign In Now