Economic concerns deepen for China

Entry posted by MongiIG in Market News
822 views
Hong Kong's Hang Seng index hit its lowest level in 13 years this week while Xi's economic blueprint doesn't offer much help to stop the downtrend.
 Source: Bloomberg
Hong Kong's Hang Seng Index hit its lowest level in 13 years this week.
Despite a brief reprieve occurred at the possibility that China would consider changes to its Covid-19 quarantine requirements doesn't offer much help to stop the downtrend.
While China's twice-a-decade Communist Party Congress meeting hasn't released any official report yet, all the signs are pointing to the highly-anticipated decision that President Xi Jinping would secure an unprecedented third term to rule the world's second-largest economy.
By the end of this week, China's 1.4 billion people will also find out the new leadership team to stand next to him for the next five years.
In the economic space, the future that Xi promised in a two-hour speech that China will double its GDP in 2035 didn't restore much confidence in China's economic outlook.
Instead, the "indefinitely” postponed Q3 GDP data released on Monday was the latest signal of deepening concern over the actual print as it is unlikely to be a positive surprise to trigger such a move.
Last Friday, the government also failed to release data on exports and imports for September with no explanation.
Hang Seng daily chart
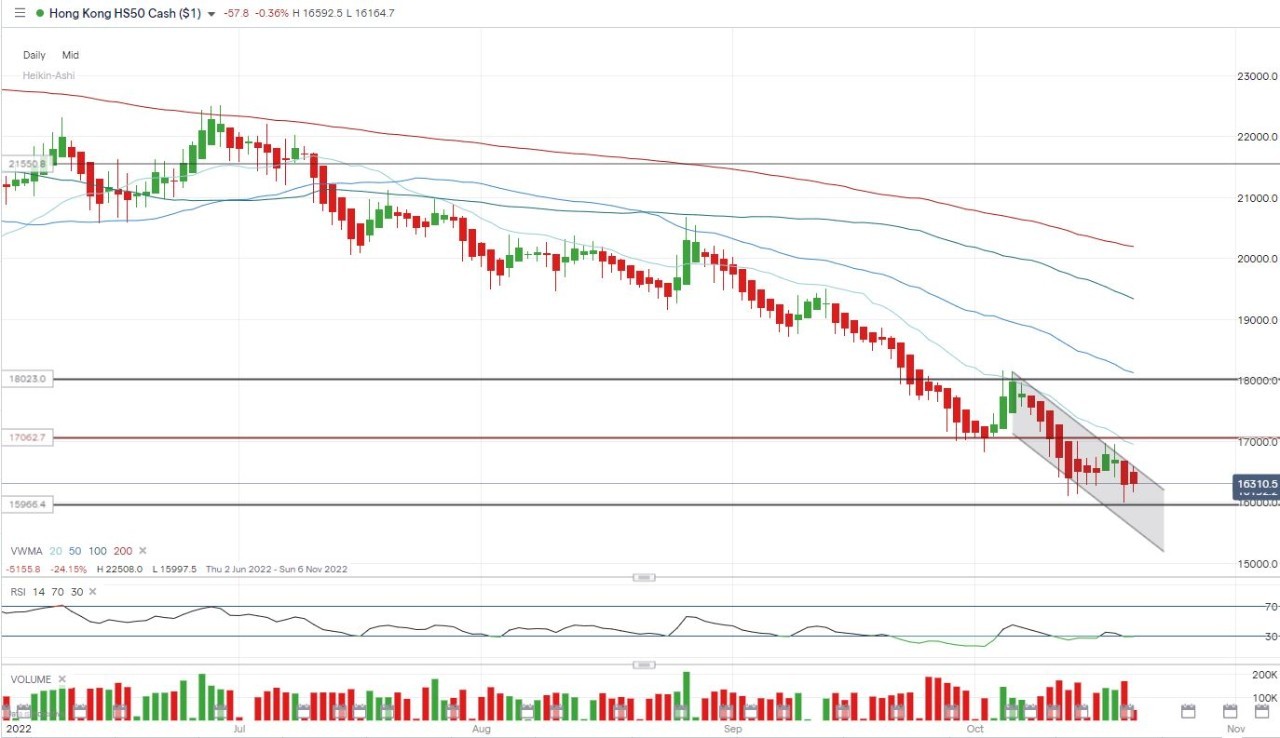 Source: IG
From a technical viewpoint, the downtrend for the Hang Seng is getting steeper after the price broke through the support from the February 2016 low.
Moreover, the double-head pattern shown in the monthly chart doesn’t bode well for an optimistic outlook. Therefore, it’s not hard to foresee that the possible close below the 2011 low will trigger elevated selling pressure.
In the near term, given that the Hang Seng has been following a descending trajectory for the past two weeks (refer to the daily chart), the trend line should see the price oscillating in the moving tunnel.
On the topside, resistance could be at the recent peak of 16993 (Oct 18th) and imminent support sits at 15930.
Hang Seng monthly chart
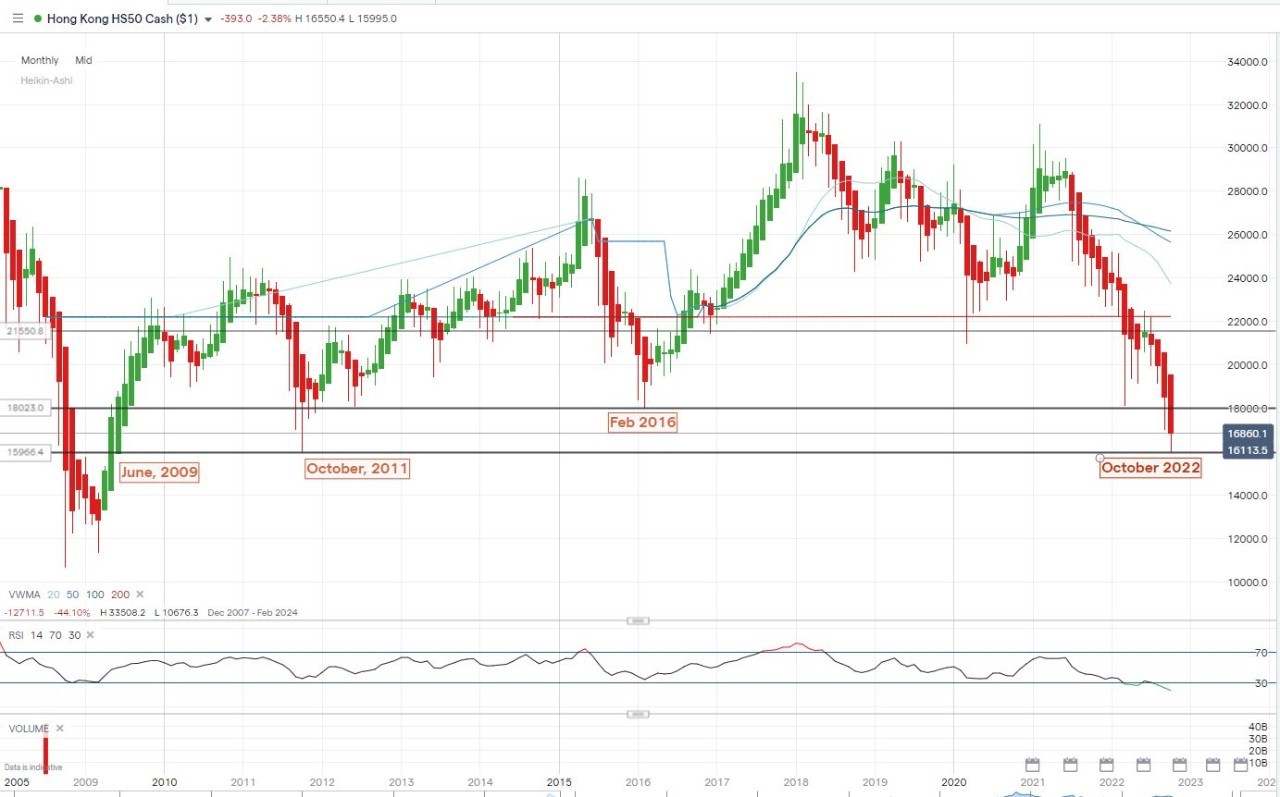 Source: IG


0 Comments
Recommended Comments
There are no comments to display.
Create an account or sign in to comment
You need to be a member in order to leave a comment
Create an account
Sign up for a new account in our community. It's easy!
Register a new accountSign in
Already have an account? Sign in here.
Sign In Now