De-risking ahead of FOMC meeting: DJIA, Straits Times Index, GBP/USD

Entry posted by MongiIG in Market News
841 views
US two-year Treasury yields pushed higher overnight, reflecting increased doubts that the Fed may not signal for a clear downshifting in rate hikes as what many would expect.
 Source: Bloomberg
Market Recap
The lead-up to the Federal Open Market Committee (FOMC) meeting outcome brought further de-risking in US equities overnight, as US two-year Treasury yields pushed higher, reflecting increased doubts that the Federal Reserve (Fed) may not signal for a clear downshifting in rate hikes as what many would have expected. Some unwinding of ‘dovish pivot’ bets were brought on by better-than-expected economic data, more notably with the US ISM manufacturing Purchasing Managers' Index (PMI) and September US job opening figure both coming in higher than forecast. This spurred concerns that economic conditions may not be moderating as quickly and that the US labour market remains tight, which runs the risks of further wage pressures driving persistence in inflation. However, a pocket of optimism is that ISM manufacturing prices have come in sharply below estimates (46.6 versus 52.5) at its two-year low, which provides a positive sign that pricing pressures are moderating, hence providing a mixed view overall.
An initial retracement in US 10-year yields saw an eventual holding-up above 4%. The US dollar continues on its recent upside, after finding support off a near-term descending channel pattern. A retest of the 113.00 level will be key to watch, where the upper channel trendline resides. Heading into the FOMC meeting outcome today, the Fed Funds futures continue to show a firm lean towards a 75 basis-point (bp) rate hike, but views are split for the December meeting, along with the longer-term terminal rate. These will be what market participants will be seeking answers for and until greater clarity is attained, a largely wait-and-see may be presented.
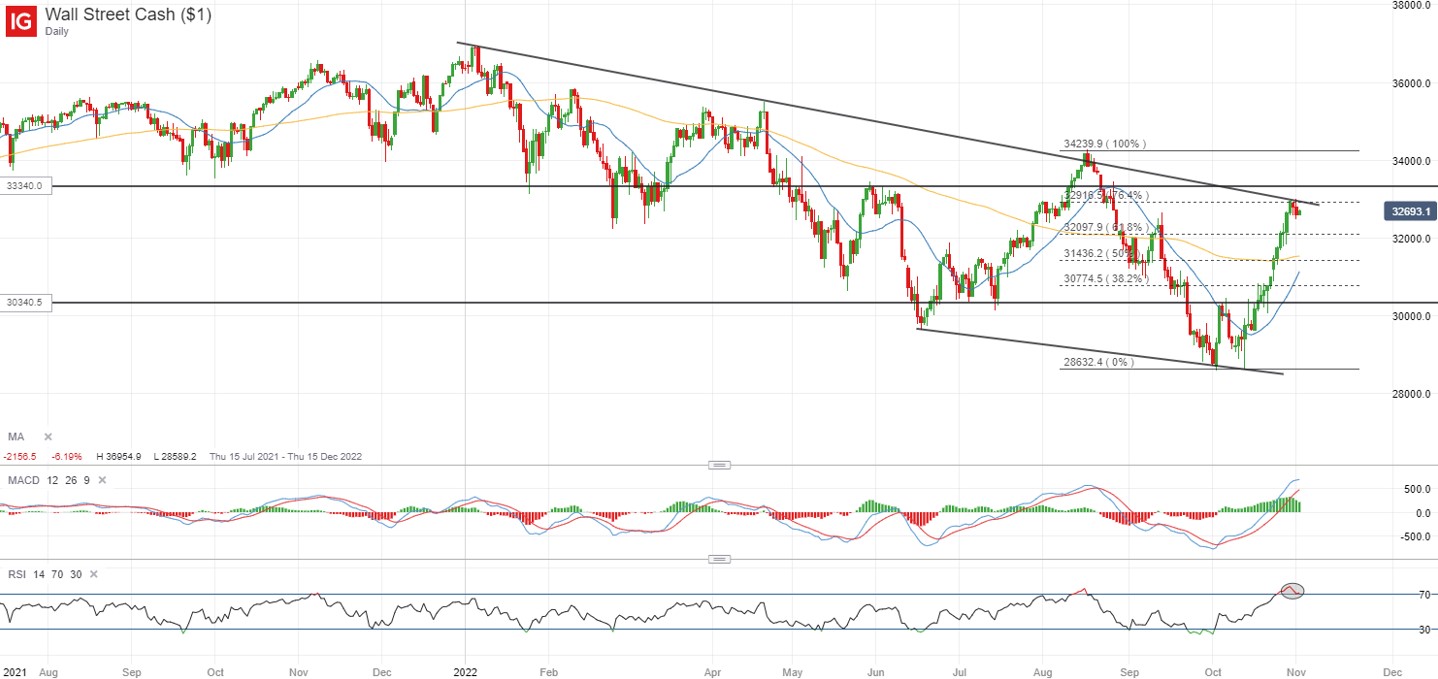
After a 15% surge from its October bottom, the Dow Jones Industrial Average (DJIA) is currently hovering at its key resistance at the 32,900 level. This level marks the confluence of a longer-term downward trendline and a 76.4% Fibonacci retracement level, if drawn from its August peak to recent bottom. Failure to overcome the trendline resistance could point to the formation of another lower high and reiterate its ongoing downward trend for another leg lower. Any retracement will leave the 32,100 level on watch as near-term support.
 Source: IG charts
Asia Open
Asian stocks look set for a mixed open, with Nikkei -0.14%, ASX +0.23% and KOSPI +0.20% at the time of writing. With the muted moves in US equity futures this morning, sentiments in the Asia session could largely hold on to some wait-and-see as well, but eyes will remain on Chinese equities after its stellar performance yesterday. The broad-based 3-5% surge in Chinese indices yesterday was triggered by an unverified note on social media reporting that a committee is being set up to prepare for a full economic reopening in March next year. There has not been any confirmation from authorities thus far and if there is the lack of follow-up on that front, the initial enthusiasm could see some fading and leave sentiments to tap on the global risk environment instead. Therefore, some caution could still seem to be warranted.
The economic calendar in Asia saw a further pickup in South Korea’s October inflation rate, with the slight outperformance edging some expectations towards a 50 bp for its 24 November meeting. Elsewhere, the downturn in the housing market on rising debt costs and falling home prices are warned to weigh on economic activities by the Reserve Bank of New Zealand (RBNZ). Australia’s home loans are declining much more than expected (-9.3% month-on-month versus -2.65% expected) as well, with the negative impact from higher rates potentially leading to further pullback in consumer spending into next year.
For the Straits Times Index (STI), it has managed to defend its key psychological 3,000 level for now, riding on previous improved global risk environment and earnings resilience in the likes of UOB. That said, it is approaching a key resistance at around the 3,175–3,200 range, where a confluence of moving averages (MA) seems to reside with a key 61.8% Fibonacci retracement. The lower highs and lower lows since March this year retains its overall downward bias, which could leave the formation of any new lower high on watch ahead.
 Source: IG charts
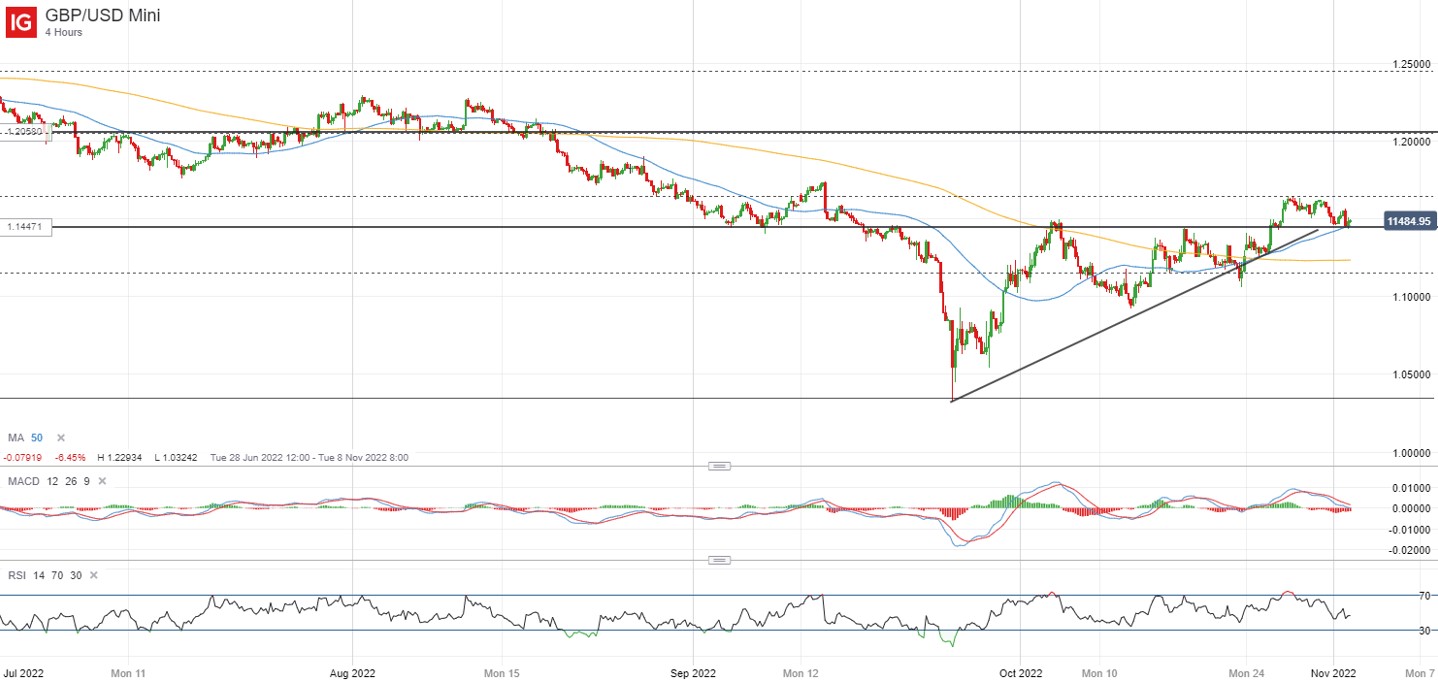
On the watchlist: GBP/USD hanging at key resistance-turned-support ahead of FOMC meeting
After breaking out of an ascending triangle pattern, renewed strength in the US dollar ahead of the FOMC meeting has translated to some near-term headwind for the cable, with the pair back to retest its key 1.145 level. On the four-hour chart, this marks the confluence between a previous resistance-turned-support level and its 50-period MA. Near-term moves will revolve around whether we will get a clear Fed guidance in the toning down of hikes after this week. In the event of any disappointment, a breach below the 1.145 level could pave the way towards the 1.114 level next and reverses its current near-term upward trend.
 Source: IG charts
Tuesday: DJIA -0.24%; S&P 500 -0.41%; Nasdaq -0.89%, DAX +0.64%, FTSE +1.29%


.jpeg.98f0cfe51803b4af23bc6b06b29ba6ff.jpeg)


0 Comments
Recommended Comments
There are no comments to display.
Create an account or sign in to comment
You need to be a member in order to leave a comment
Create an account
Sign up for a new account in our community. It's easy!
Register a new accountSign in
Already have an account? Sign in here.
Sign In Now