GBP/USD: Outlook for 2023

Entry posted by MongiIG in Market News
702 views
Tested technicals, unfavourable fundamentals, and sell sentiment amongst CoT speculators.
 Source: Bloomberg
Comeback kid might be a term frequently used for this pair’s price after its ability to recover off the 1.03 lows, but when viewed from the start of 2022 where it opened in the 1.35s, it still has quite a journey ahead of it.
While investors might not have to worry about contrasting monetary and fiscal policies compared to a few months back when both the pound and the gilt market suffered heavily, there are still fundamental worries to contend with over the course of next year.
Inflation remains hot with October’s CPI (Consumer Price Index) reading above estimates at 11.1% year-on-year (y/y) and its core failing to drop from 6.5%. While the Bank of England’s forecasts is for a sizable drop from the middle of 2023 onwards, one of the three reasons cited is a drop in demand for goods and services in the UK.
Recession – and a lengthy one at that – is within the central bank’s expectations and means rate hikes aren’t expected to be as sizable moving forward with a peak rate potentially seen at the start of next year.
Risk-related flows, energy prices, and where the dollar resides will also prove crucial, as should the worst in terms of inflationary pressures in the US subside over the next few months.
Given consecutive clear drops are what the Federal Reserve requires, it might help put a lid on or even reverse dollar strength and in turn aid risk-on moves that are usually pound-friendly. That sort of positive backdrop will be needed to help recent shorter-term technical moves translate into undoing a longer-term strained overview.
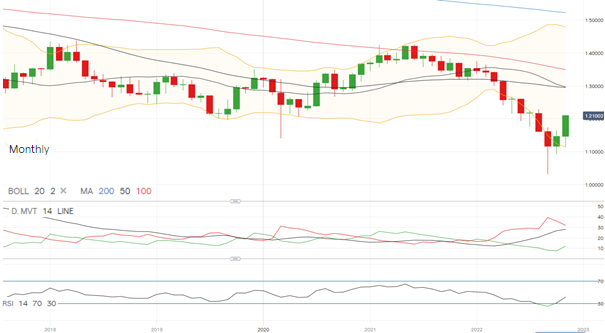
GBP/USD monthly chart with key technical indicators
A brief look at the monthly chart and key technical indicators, and the partial recovery while easing the technical picture in some areas, remains a difficult one to contend with.
- Prices are still beneath the key monthly moving averages that in this time frame will take far longer to adjust compared to shorter-term time frames.
- DMI (Directional Movement Index) is still heavily tested with the –DI margin to +DI while narrowing slightly still at high levels compared to 2016. It marked the lows back then, but in 2008 after the drop from the 1.98s was far from it continuing to decline thereafter from 1.62 into the 1.35s.
- RSI (Relative Strength Index) is no longer in oversold territory with the exit being a reliable indicator in the recent past on the monthly time frame in terms of passing the lows in price.
- An ADX reading has recently crossed into trending territory above 25. The monthly ADX usually reaches or is near the end of its trend above 31 with 40 marking the start of the end of a trend move, and based on that alone implies the worst from a technical standpoint might not be over just yet.
 Source: IG
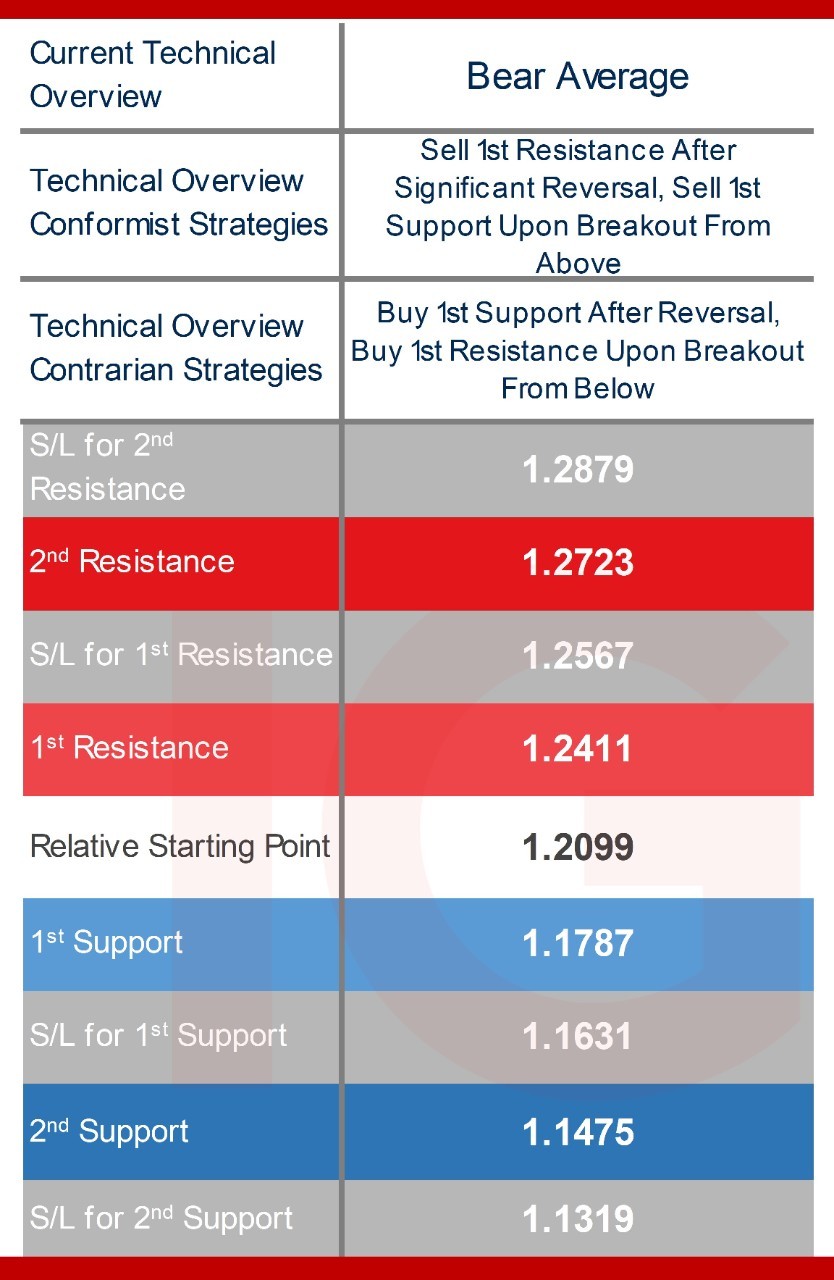
GBP/USD technical analysis, overview, strategies, and levels
The technical overview is showing negative bias in longer-term time frames like the weekly and monthly charts. It is more conflicting in the short-term due to the partial lift off the lows within a short-term wide bull trend channel tilting shorter-term technical indicators.
The overview on the daily time frame is a contrasting bull average where intraday traders ought to note where prices reside within the channel as prices generally stick to a slowly moving average.
For the monthly time frame, while an ADX in trending territory makes it more trend-like, further downside momentum will be required to take it into a bear trend technical overview, making it more bear average in the sense of net averaging lower, and meaning conformist strategies will be sell while contrarian buys, but noting key channels and support & resistance levels more than under a typical bear trend classification.
 Source: IG
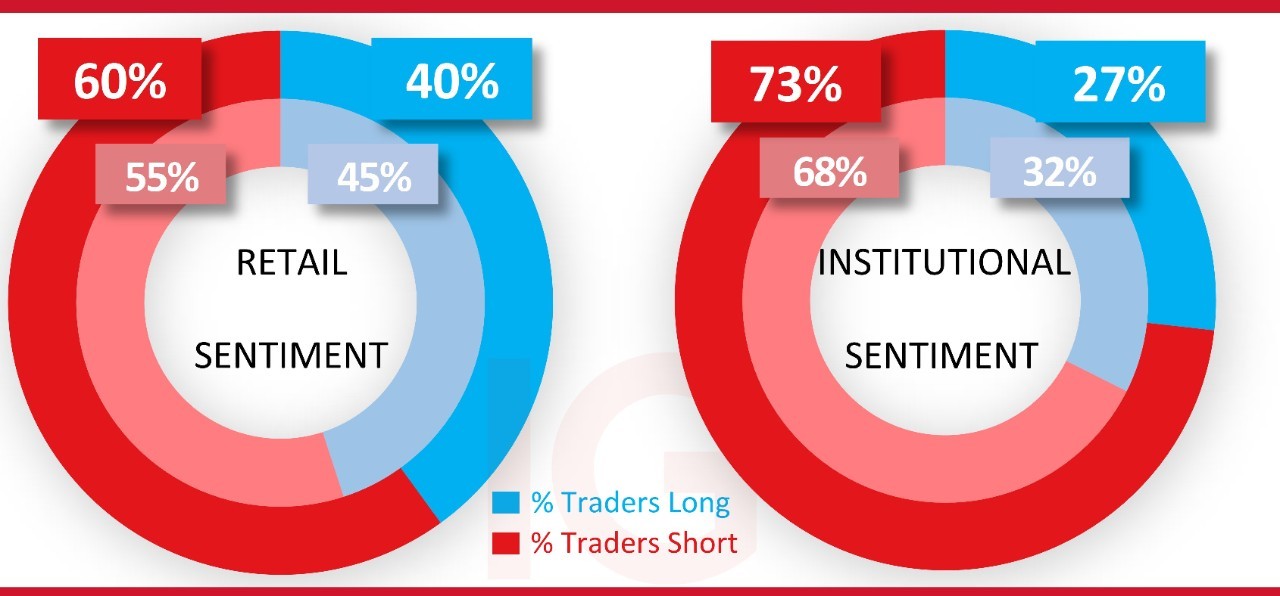
IG client* and CoT** sentiment for GBP/USD
Retail trader bias spent most of 2022 in majority buy territory with the shift from the middle to majority long occurring in February where prices peaked, and spending most of the year at heavy to extreme buy levels.
The recovery off the lows even if partial caused the long run of majority buy sentiment amongst them to shift to the middle only very recently, and thereafter turn majority short.
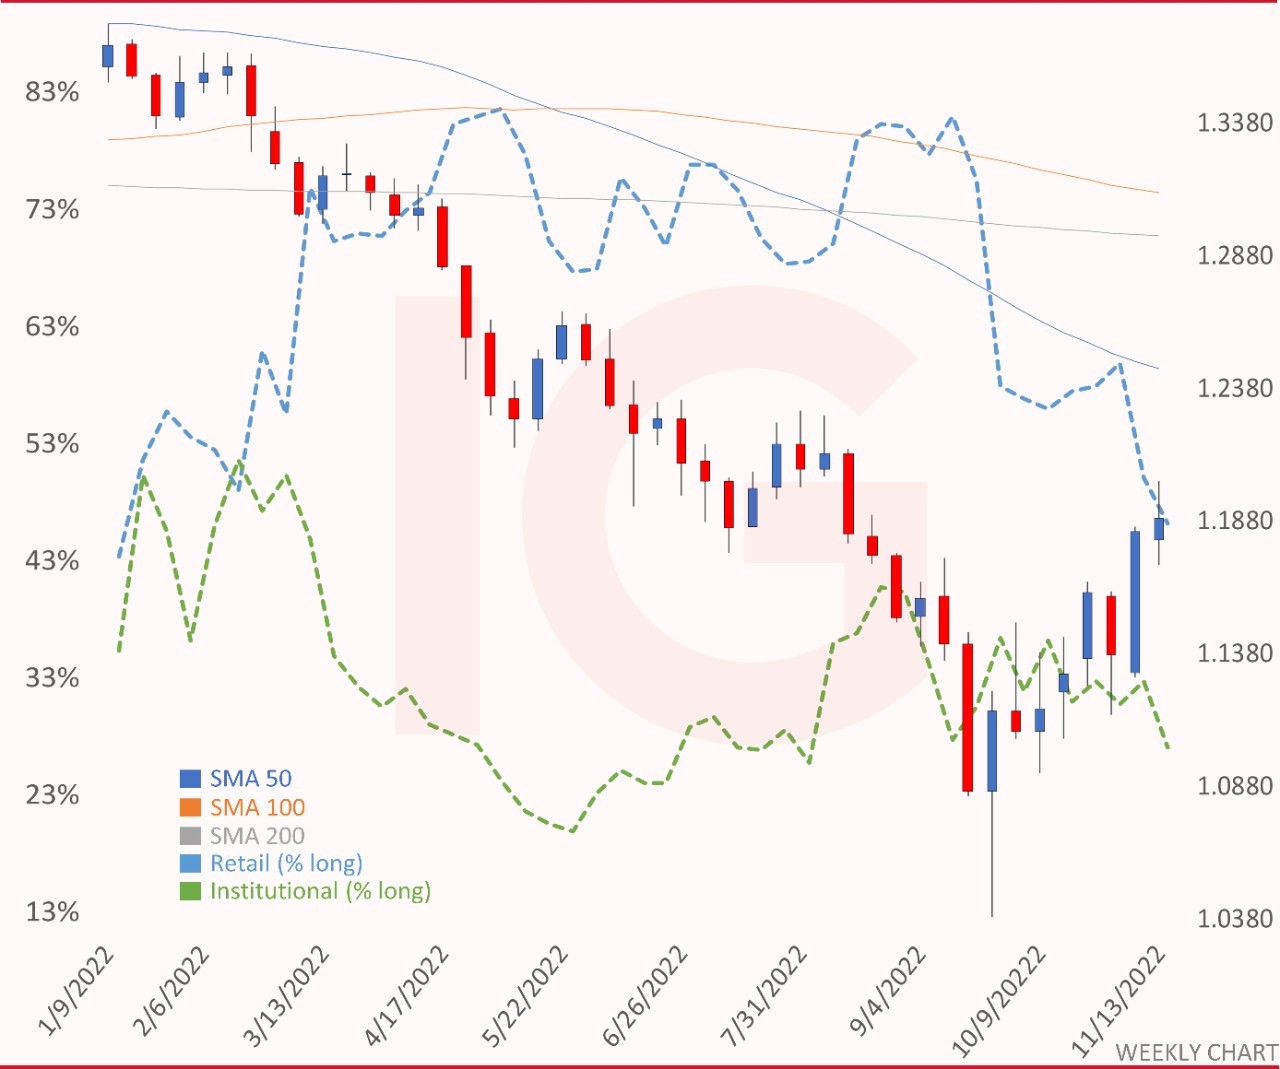
If history is any indication, any further downside moves will likely cause traders to buy with more caution and with a larger distance between entry points, unless preceded by significant oscillations for a prolonged period shaking out trend-traders and forcing range-traders into forgetting September’s volatility.
As for CoT speculators on the institutional side, it is still in majority short and largely in heavy sell territory. Though it has had more to do with both long and short positioning dropping sizably and in the case of the former, to half levels seen in September.
The latest report shows GBP longs at 24,699 lots with shorts at 67,533, for the latter no longer above 100K lots and below the roughly 150K in October of 2016 when the pound dropped from about 1.30 briefly into the 1.18s.
CoT individuals are also majority short and at a similar level to larger speculators, at 65%.
 Source: IG
GBP/USD Weekly Chart with retail and institutional sentiment (as of November 18th close)
 Source: IG


0 Comments
Recommended Comments
There are no comments to display.
Create an account or sign in to comment
You need to be a member in order to leave a comment
Create an account
Sign up for a new account in our community. It's easy!
Register a new accountSign in
Already have an account? Sign in here.
Sign In Now