Hang Seng Index: Year-end attempt to overcome key 200-day moving average

Entry posted by MongiIG in Market News
772 views
At the time of writing, the Hang Seng Index has jumped more than 500 points or 2.75% higher into today’s session.
 Source: Bloomberg
Yeap Jun Rong | Market Strategist, Singapore | Publication date: Thursday 22 December 2022
Hang Seng Index: Authorities’ focus on economic growth finding further validation
At the time of writing, the Hang Seng Index has jumped more than 500 points or 2.75% higher into today’s session. Strength among its constituents NB has been broad-based, with gains in technology, property and consumer-related sectors. The Hang Seng Tech Index and Hang Seng Properties are up 4.6% and 1.9% respectively, with the authorities’ ongoing shift in focus towards economic growth finding further validation into today’s session. The State Council stated that China will step up efforts to implement pro-growth measures, with more financial avenues for its property sector, further implementation of fiscal support in 2023 and mechanism for US-China cooperation in audit supervision for platform companies.
Previously, guidance for policy support from authorities has been largely shrugged off or was met with lukewarm market reactions at best, as its tough zero-Covid stance was largely viewed to be standing in the way for any successful implementation. That has since changed when China pivoted towards a gradual economic reopening. That reopening optimism is present in today’s risk-on session as well, with consumer-related stocks such as Haidilao (+8.9%), Li Ning (+6.8%) and Shenzhou International (+6.6%) being the top performers.
What’s next?
China’s reopening narrative has drawn in a lot of market optimism, which came after Chinese equities’ prices have been beaten down to its multi-year low, and valuation are relatively attractive both on a historical basis and against their global peers. These optimism could still face some near-term pushback if economic data over the coming months failed to meet market expectations, as intermittent virus waves may run the risks of limiting consumer spending recovery and disrupting proper functioning to its workforce. The upcoming Lunar New Year period (travel rush starts from 7-21 January 2023, actual festive period is 21-27 January) will also be on watch with almost-certain spikes in virus cases after the people are deprived of a proper celebration over the past two years.
Nevertheless, the step towards economic reopening and shift in authorities’ focus toward growth may be a positive development over the longer term. Room for corporate earnings to improve when Covid-19 risks eventually abate may call for some upward valuation re-rating and provide catch-up to its historical average.
Technical analysis: 200-day MA being retested
After facing heavy resistance at its 200-day moving average (MA) since early-December, today’s upmove marks another retest of the key MA-line, which is generally looked upon as an indication of longer-term trend. It seems that equity bulls are attempting to shrug off the bearish crossover on its moving average convergence/divergence (MACD) and tapping on the relatively lower-volume, limited catalysts year-end period to set the tone into 2023.
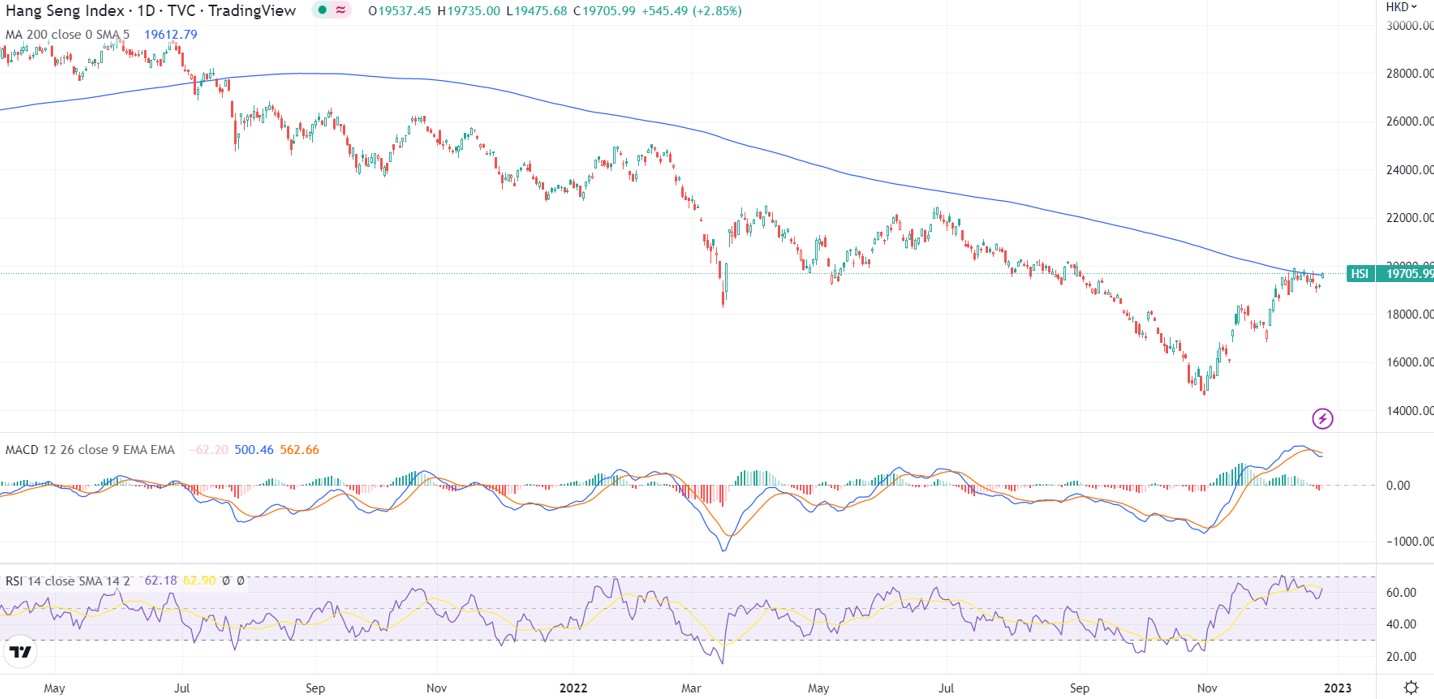 Source: TradingView
Since November this year, the index has been trading on a rising wedge pattern, with the series of higher highs and higher lows supportive of an upward bias for now. On the downside, the lower wedge trendline may be on watch for any near-term support. A greater area of support may be at the 18,550 level, which marked a key Fibonacci confluence zone.
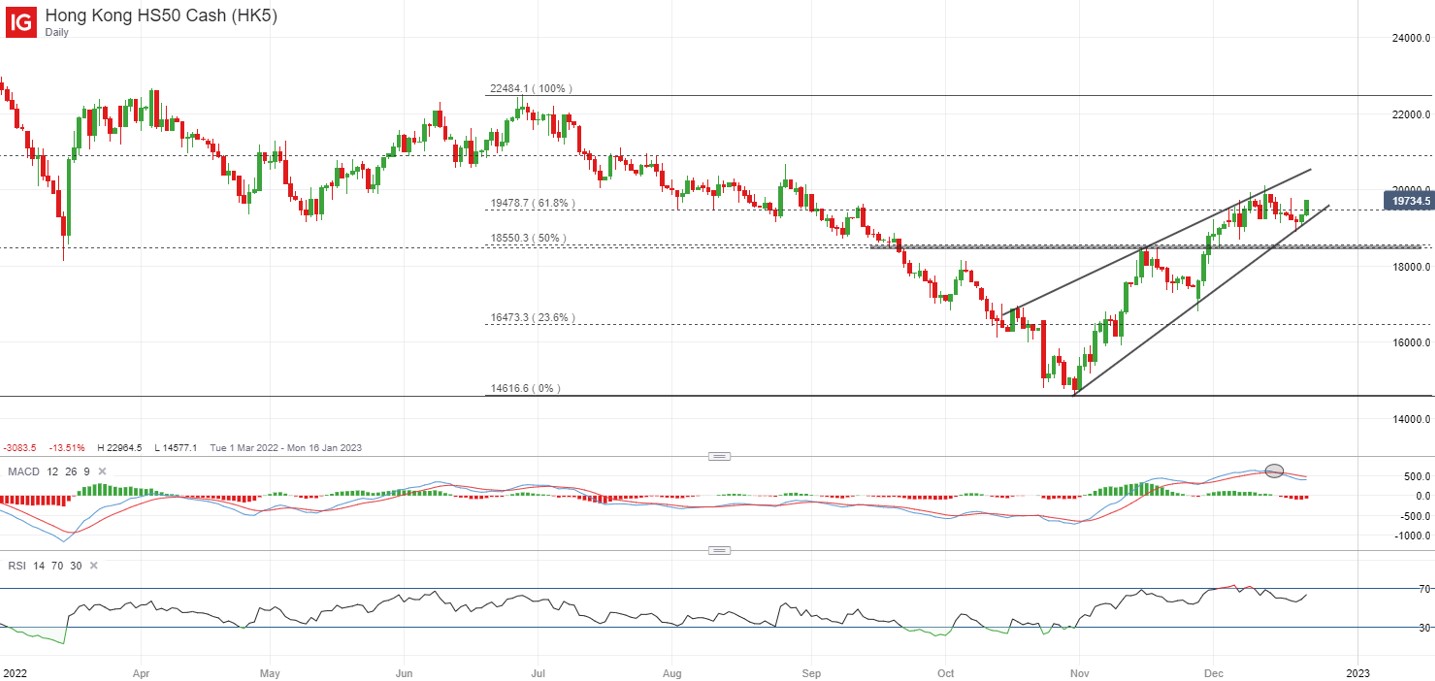 Source: IG charts


0 Comments
Recommended Comments
There are no comments to display.
Create an account or sign in to comment
You need to be a member in order to leave a comment
Create an account
Sign up for a new account in our community. It's easy!
Register a new accountSign in
Already have an account? Sign in here.
Sign In Now