Wall Street staged a comeback overnight: Nasdaq 100, Straits Times Index, CAD/JPY

Entry posted by MongiIG in Market News
1,041 views
Despite initial jitters over Microsoft’s results overnight, equity bulls managed to retain control with major US indices paring almost all its losses by the close.
 Source: Bloomberg
Market Recap
Despite initial jitters over Microsoft’s results overnight, equity bulls managed to retain control with major US indices paring almost all their losses by the close (DJIA +0.03%; S&P 500 -0.02%; Nasdaq -0.18%). With that, the S&P 500 has defended its 3,980-4,000 region with the formation of a bullish pin bar, clinging above its key downward trendline support. US Treasury yields trended slightly lower after a face-off with their respective resistance, notably the 100-day moving average (MA) for the two-year yields and an upward trendline resistance for the 10-year. The US dollar also struggled to find gains for now, despite nearing its near-term support at the 101.28 level. US stock futures saw a slight uplift from Tesla’s result releases this morning, with the company’s top and bottom-line beat boosting share price by 5.4% in after-hours trading. Despite initial concerns over its sharp decline in vehicle profit margins, market participants seem to have bought into Chief Executive Elon Musk’s guidance that aggressive price cuts will support demand outlook.
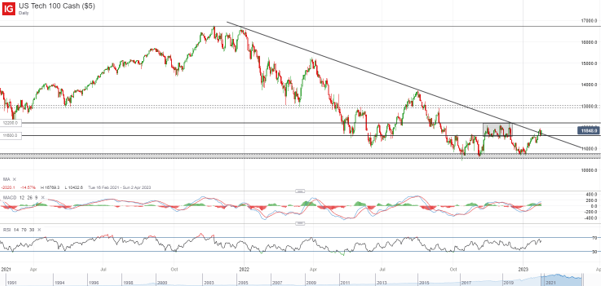
Ahead, the advance estimate for US quarter four (Q4) GDP will be on watch later today, with a more resilient number being looked upon to provide more conviction of a potential ‘soft landing’ and room to avoid a recession ahead. Current expectations are for US Q4 GDP to come in at 2.8% quarter-on-quarter, down from the previous 3.2%. For now, the Nasdaq 100 index has managed to hold onto a confluence of support at the 11,600 level. Further upside will leave the 12,200 level in focus next, which marks the top end of its previous consolidation zone.
 Source: IG Charts
Asia Open
Asian stocks look set for a flat open, with Nikkei +0.02% and KOSPI +0.14% at the time of writing. The Australian market is closed for holiday today. On the other hand, Hong Kong markets will be back online after its Chinese New Year break, with some positive catch-up performance likely on the table. This morning’s economic calendar saw a deeper-than-expected contraction in South Korea’s Q4 real GDP (-0.4% versus -0.3% forecast) as moderation in global demand continues to take a toll on its economy. Private consumption dipped by 0.4% while exports contracted by 5.8%. With the data being somewhat backward-looking and pre-empted by policymakers previously, the KOSPI managed to hold onto its gains with the resilient global risk environment. On another front, the summary of opinions from the Bank of Japan (BoJ) revealed policymakers sticking to their views on ‘transitory’ inflation, with more wait-and-see for further pick-up in wages. The USD/JPY remains capped by a descending channel pattern, with the upper channel trendline at 130.80 serving as key resistance to overcome.
After trading within a period of consolidation since mid-November, the Straits Times Index has managed to find a clearer direction lately with buyers taking control. The 3,380 level may be on watch as near-term resistance, where earlier retests in February and April last year were met with strong selling pressure. Overcoming this level could potentially pave the way to retest its post-Covid high at the 3,490 level.
 Source: IG Charts
On the watchlist: Policy divergence may leave further downside in CAD/JPY in focus
At the latest BoC meeting, the central bank raised policy interest rate by 25 bp to 4.5% and confirmed market expectations of a peak in rate by signalling for a potential pause ahead to assess the impact of cumulative rate increases. This decision is looked upon as a dovish takeaway by markets, supported by the central bank’s projections of stalling growth and significant decline in inflation in 2023. With that, the narrative of policy divergence could be on watch for the CAD/JPY, where expectations continue to brew for the BoJ to step away from its accommodative policies this year while in the case of the BoC, a rate cut may be the next phase of speculation. After breaking below its 200-day MA in mid-November last year, the pair has been trading on lower highs and lower lows as an indication of a downward bias. A falling wedge pattern keeps recent price action in place for now, with the 97.56 level serving as a confluence of resistance to overcome. Further downside may leave the 94.50 level in focus, which marks its 10-month low.
 Source: IG Charts
Wednesday: DJIA +0.03%; S&P 500 -0.02%; Nasdaq -0.18%, DAX -0.08%, FTSE -0.16%


0 Comments
Recommended Comments
There are no comments to display.
Create an account or sign in to comment
You need to be a member in order to leave a comment
Create an account
Sign up for a new account in our community. It's easy!
Register a new accountSign in
Already have an account? Sign in here.
Sign In Now