Renewed strength in US dollar on economic data: S&P 500, USD/JPY, Silver

Entry posted by MongiIG in Market News
498 views
US equity indices managed to find their way higher in the aftermath of the Fed meeting, but were challenged by upside surprises in the US labour market and services sector activities to end last week.
 Source: Bloomberg
Market Recap
US equity indices managed to find their way higher in the aftermath of the Federal Reserve (Fed) meeting, but were challenged by upside surprises in the US labour market and services sector activities to end last week. The US January non-farm payroll delivered a shocking read (517,000 versus 185,000 consensus), with unemployment rate heading to 3.4% compared to an expected increase to 3.6%. The US Institute for Supply Management (ISM) services Purchasing Managers' Index (PMI) also pulled way past expectations at 55.2 (50.4 forecast), with notably, the surprise turnaround in new orders (60.4 from previous 45.2). Both data suggested that economic conditions are still resilient to weather more rate hikes from the Fed, with the narrative fuelling a lean in interest rate expectations above 5%. Two more 25 basis-point hikes from the Fed are now the consensus, pushing back the timeline for a potential rate pause to May 2023.
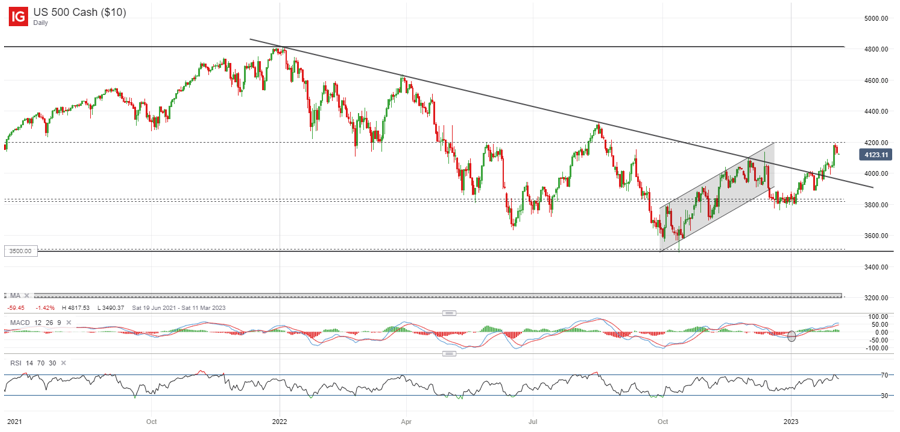
The US dollar index found renewed strength (+1.1%) from the more aggressive rate bets, with the US two-year yields jumping 20 basis-point to 4.3%. The 10-year yields are also up 13 basis-point points, seemingly finding support from its 200-day moving average (MA). Any further uptick in yields could see the US dollar pushing higher while rate-sensitive growth stocks heading lower. That said, previous attempts for the US dollar to bounce have been short-lived, with the downward trend raising the odds for the formation of a lower high. The S&P 500 is taking a breather off the 4,200 level of resistance, with the failure for VIX to move higher last Friday still pointing to some resilience in the risk environment. Any near term close below last Thursday’s candle may prompt further downside, but with the ongoing upward bias, any formation of a higher low could still be on the lookout.
 Source: IG charts
Asia Open
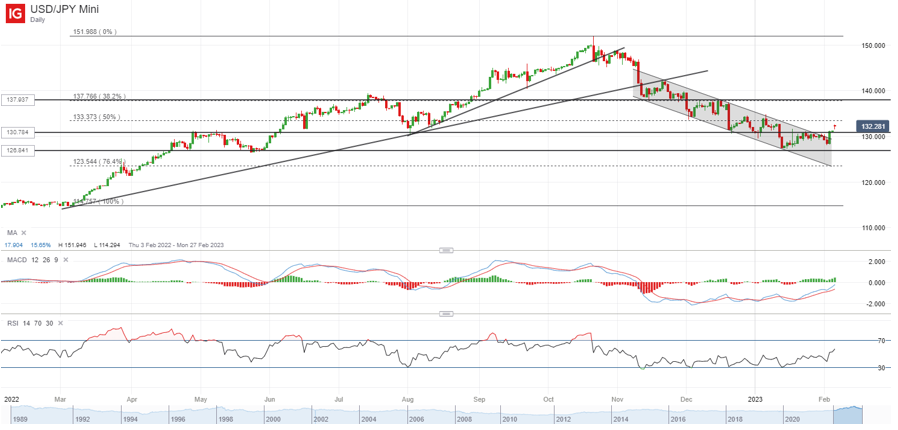
Asian stocks look set for a mixed open, with Nikkei +0.80%, ASX -0.16% and KOSPI -0.96% at the time of writing. Reports suggesting that Bank of Japan (BoJ) Deputy Governor Masayoshi Amamiya has been sounded out to be the upcoming central bank governor has seen the USD/JPY heading to 132.30 this morning. With his involvement in the current accommodative policies from the BoJ, his nomination may be perceived to support dovish expectations. The Nikkei 225 index is finding strength on potentially lower-for-longer rate, diverging from the rest of the region which is otherwise facing some pressure from the stronger dollar. With the USD/JPY having traded within a falling channel pattern since November 2022, the confluence of a weaker yen and a surprise turnaround in the US dollar seems to prompt a break above the channel, with the 130.80 level of resistance giving way last week. Further upmove could leave the 134.50 level on watch next.
 Source: IG charts
Chinese equities continue to see some profit-taking to end last week, with the Hang Seng Index retracing 5.3% thus far from its 11-month high. The shooting down of a Chinese surveillance balloon by the US has further put US-China relations on the line, potentially bringing some caution on how China may react further. That said, any move to escalate further could still seem off the table for now, as China’s economic conditions are just starting to pick up but the complicated political ties between both superpowers seem to be one to drag on for longer.
On the watchlist: Silver prices broke below previous consolidation pattern
Renewed strength in the US dollar following the robust US non-farm payroll data has prompted a 5.6% plunge in silver prices last Friday. Having largely traded in consolidation between two Fibonacci levels since mid-December last year, recent downside marked a break below the lower support base at US$22.90. The Moving Average Convergence/Divergence (MACD) has also cut into negative territory, potentially signalling a switch to downside momentum. The US$22.00 level is on watch next, with any break below US$22.00 paving the way to retest the US$20.80 level, where a 38.2% Fibonacci retracement stands alongside its 200-day MA.
 Source: IG charts
Friday: DJIA -0.38%; S&P 500 -1.04%; Nasdaq -1.59%, DAX -0.21%, FTSE +1.04%


0 Comments
Recommended Comments
There are no comments to display.
Create an account or sign in to comment
You need to be a member in order to leave a comment
Create an account
Sign up for a new account in our community. It's easy!
Register a new accountSign in
Already have an account? Sign in here.
Sign In Now