Can European equity indices sustain their rallies?

Entry posted by MongiIG in Market News
387 views
Outlook on the FTSE 100, DAX 40 and Euro Stoxx 50
 Source: Bloomberg
Why do equity indices keep rising?
With an increasing number of investors thinking that a more dovish turn from central banks is probably around the corner, despite several US Federal Reserve (Fed) members this week re-iterating its chair Jerome Powell’s comments that inflation may last “quite a bit of time” and that more rate hikes are needed to bring it down, especially if the US labour market remains strong, investors this week once again bought any short-term weakness in global equity indices.
They also did so with the backdrop of a probable soft landing for the US economy, stronger than originally anticipated growth in China, while focusing on the word “disinflation” which the Fed has now used several times in its speeches and comments.
Having said that, many institutional investors and hedge funds are hedging their bets as they still see the risk of the October-to-February advance eventually turning out to be a large bear market rally with more pain to come.
This is reflected by the total number of puts traded on the Euro Stoxx 50 which was triple that of the number of calls this week, a relatively rare occurrence.
Since overall positioning in equities remains low with most long-only funds still defensively positioned, they may be tempted to catch up when declines are seen, which is a good reason why markets could keep rising over the coming weeks and even months.
According to Refinitiv, European equity funds led money inflows for the first time in several months in the week ended Feb. 1 with European equity funds securing net inflows of $6.35 billion in the week, continuing their strong showing this year and pushing European equity indices higher.
 Source: Refinitiv – Lipper data
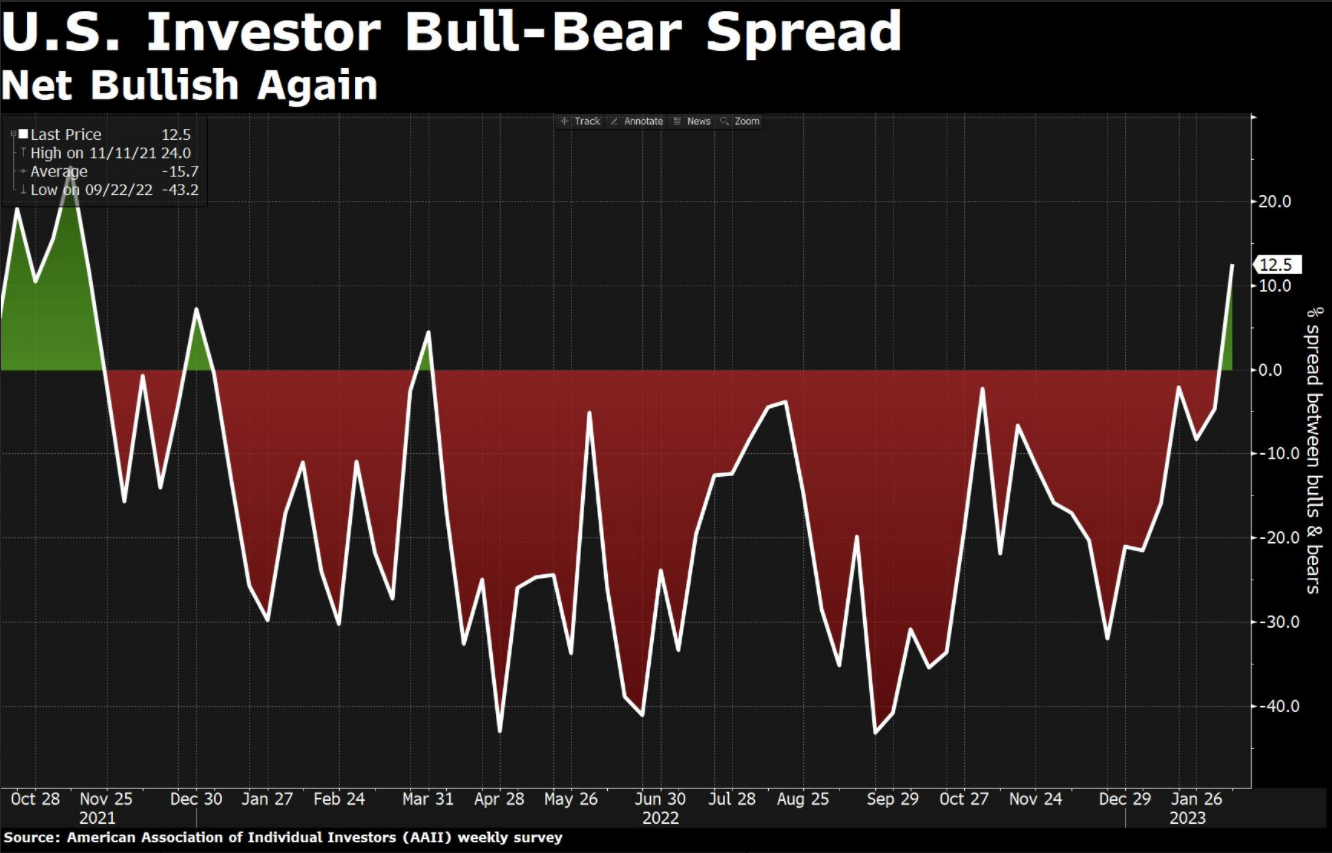
Furthermore, according to the American Association of Individual Investors (AAII) weekly survey, for the first time in over a year, the US Investor Bull-Bear Spread has risen to net bullish with it hitting levels last seen in October 2021.
 Source: AAII
The survey acts as a contrary indicator at bullish and bearish extremes, like it did in September when its multi-year low was follows by the current October-to-February advance. Though now in positive territory, it is still a long way from a possible bullish extreme.
Having said that, if next week’s US consumer price inflation (CPI) data were to disappoint and worries about a possible global recession rear its head again, equity markets may swiftly come off this year’s lofty heights.
After all many larger investors still expect an economic slowdown to negatively affect share prices in the second half of this year.
Where to next for European equity indices?
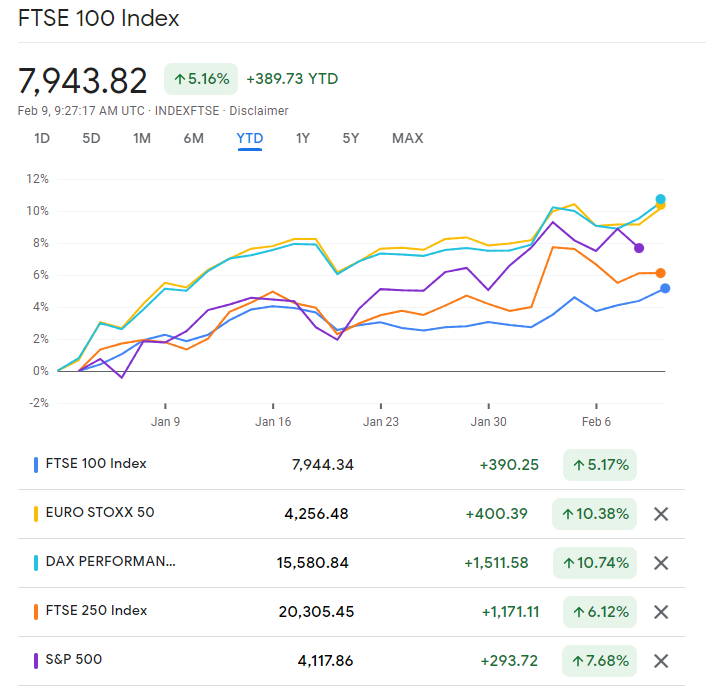
European equities are to a large degree still outperforming their US counterparts year-to-date with both the DAX 40 and the Euro Stoxx 50 trading at over +10% compared to the S&P 500’s near 8%, with the FTSE 100 being the laggard with around +5% despite trading in new all-time highs.
 Source: Google Finance
Technical Analysis on the Euro Stoxx 50, DAX 40 and FTSE 100
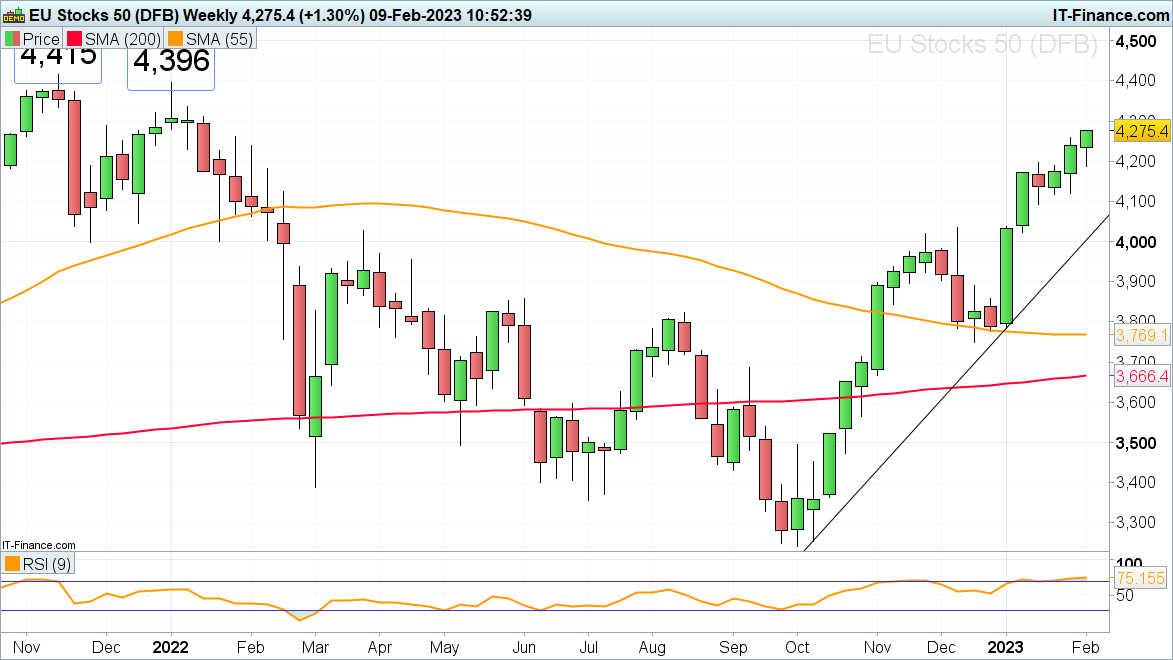
Euro Stoxx 50 trades in one-year highs
The Euro Stoxx 50 is trading in one-year highs and is approaching its February 2022 high at 4,260, above which the November 2021 and January 2022 highs can be found at 4,396 to 4,415.
 Source: ProRealTime
While the 19 January low at 4,092 underpins on a daily chart closing basis, the medium-term uptrend technically remains intact.
 Source: ProRealTime
DAX 40 rallies to one-year high
The DAX 40 continues to surge higher and remains in a clearly defined uptrend with a series of higher highs and higher lows being spotted on the daily chart, having this week reached levels last traded in February 2022.
 Source: ProRealTime
It is about to hit its 15,739 February 2022 peak, above which sits the December 2021 high at 15,872, ahead of the November 2021 to January 2022 key resistance area which can be found at 16,288 to 16,298.
 Source: ProRealTime
The medium-term uptrend will remain valid as long as no bearish reversal takes the DAX 40 to below its 19 January low at 14,904 on a daily chart closing basis. It is where the index held for the second half of January and as such represents key support.
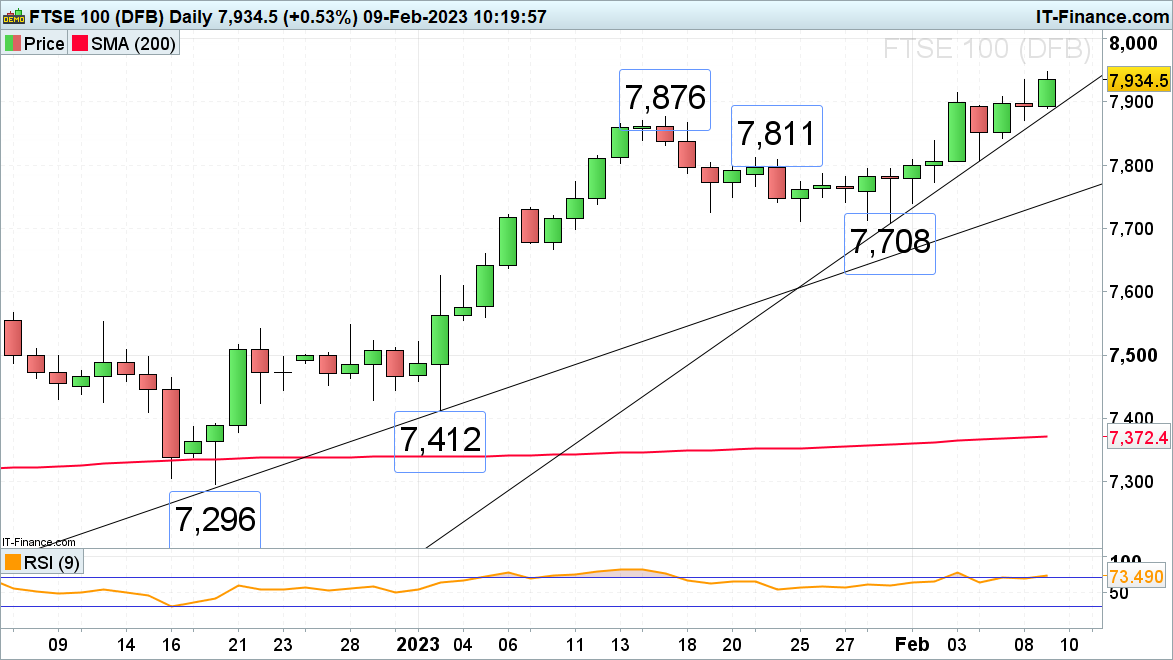
FTSE 100 trades in new all-time highs
The FTSE 100 trades in new all-time highs and so far remains on track to reach the psychological 8,000 mark.
Its medium-term uptrend will remain intact while the index stays above its 7,708 late January low on a daily chart closing basis.
 Source: ProRealTime


0 Comments
Recommended Comments
There are no comments to display.
Create an account or sign in to comment
You need to be a member in order to leave a comment
Create an account
Sign up for a new account in our community. It's easy!
Register a new accountSign in
Already have an account? Sign in here.
Sign In Now