All eyes on US job report ahead: DJIA, Nikkei 225, AUD/NZD

Entry posted by MongiIG in Market News
325 views
Following an initial hawkish takeaway, Fed Chair Jerome Powell tried to calm some nerves with a softer tone on his second day of testimony, but Wall Street can afford a mixed closing at best.
 Source: Bloomberg
Market Recap
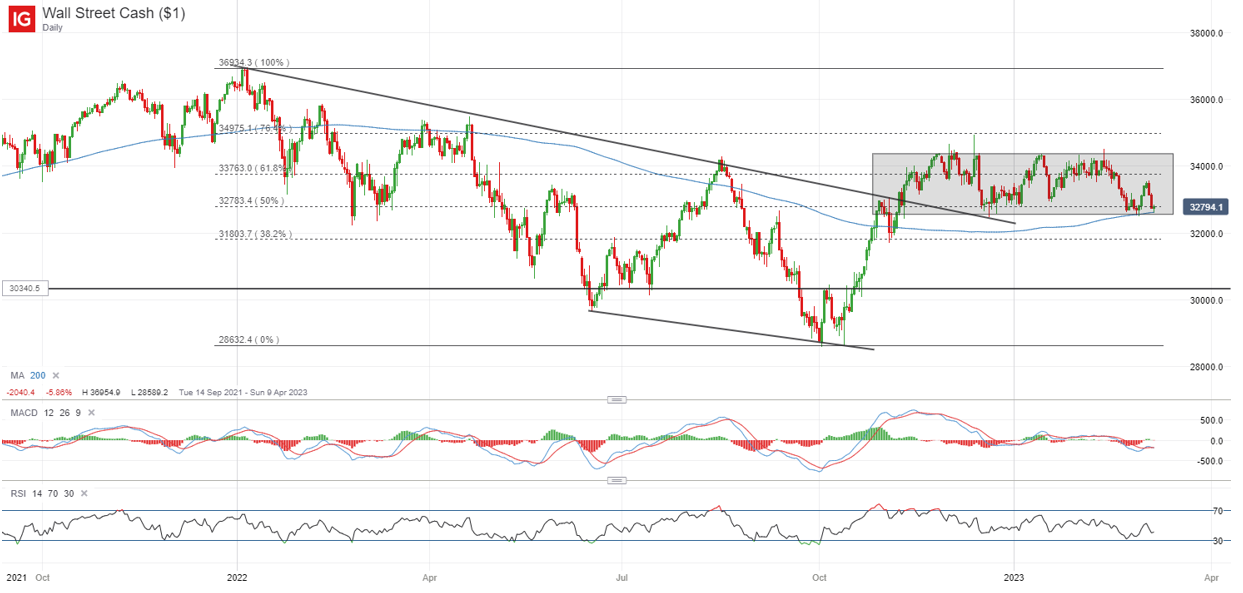
Following an initial hawkish takeaway, Federal Reserve (Fed) Chair Jerome Powell tried to calm some nerves with a softer tone on his second day of testimony, but Wall Street can afford a mixed closing at best. The Fed Chair put on a less committal and more data-dependent stance, emphasising on multiple occasions that no decision has been made on faster rate hikes yet. That places huge focus on the upcoming job report this Friday and inflation data next week, which may form the last few key data before the Federal Open Market Committee (FOMC) meeting in late-March. Below-expectations read on both fronts may be on the lookout here, with major US indices still attempting to push back against a renewed bearish trend. All three indices continue to hang above their respective 200-day moving averages (MA).
That said, higher-than-expected ADP private payroll (242,000 versus 200,000 forecast), along with still-elevated job opening numbers (10.8 million versus 10.5 million forecast) did not provide much ease for now. That continued to pave the way higher for US Treasury yields overnight, although rate-sensitive growth stocks managed to close on a stronger footing. The US dollar is largely on some wait-and-see, allowing gold and silver prices to take a breather after recent sell-off. For the DJIA, the index is back to retest the lower base of its consolidation pattern for the second time since the start of the month. Its 200-day MA could be put to the test here, with any break below previous lows on watch to instil a bearish bias. For now, the formation of a bullish pin bar still suggests some defending by dip-buyers.
 Source: IG charts
Asia Open
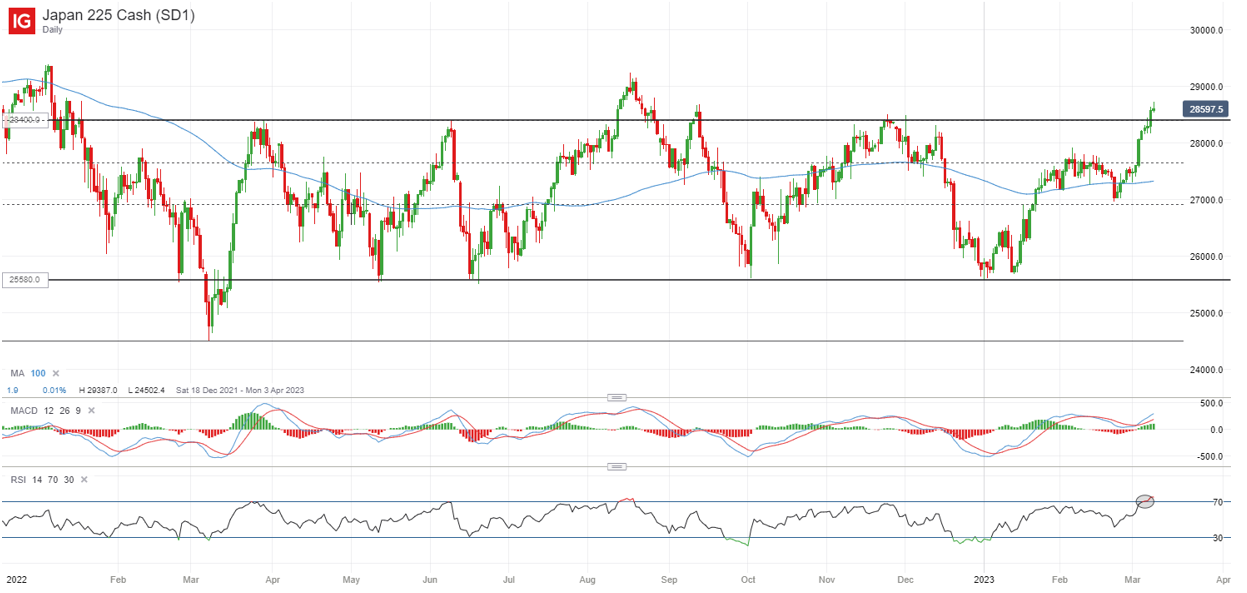
Asian stocks look set for a mixed open, with Nikkei +0.55%, ASX -0.02% and KOSPI +0.22% at the time of writing. The Nikkei continues to display a strong showing ahead of the Bank of Japan (BoJ) meeting this week, where expectations are for the ultra-easy policies to continue. Upcoming BoJ governor Kazuo Ueda has also sung the same tune as current policymakers, with market pricing for a rate hike pushed back to the September meeting (originally April/June). Following the surprise adjustment to its ten-year bond yield cap at the end of last year, it seems that the absence of any surprise may trigger a positive reaction as compared to before.
For now, the final estimate of its quarter four (Q4) gross domestic product (GDP) was revised lower this morning (0.1% versus 0.8% forecast) on the back of weaker private consumption, which drove some paring of gains in the index. Nevertheless, a break above the 28,400 resistance marked a notable achievement for the bulls. Overbought technical conditions may call for a retest of the level, with any holding up likely to pave the way towards the 29,200 level next. The economic calendar ahead will place China’s inflation figures in focus, which is expected to reflect a more gradual recovery picture with more gradual price increases.
 Source: IG charts
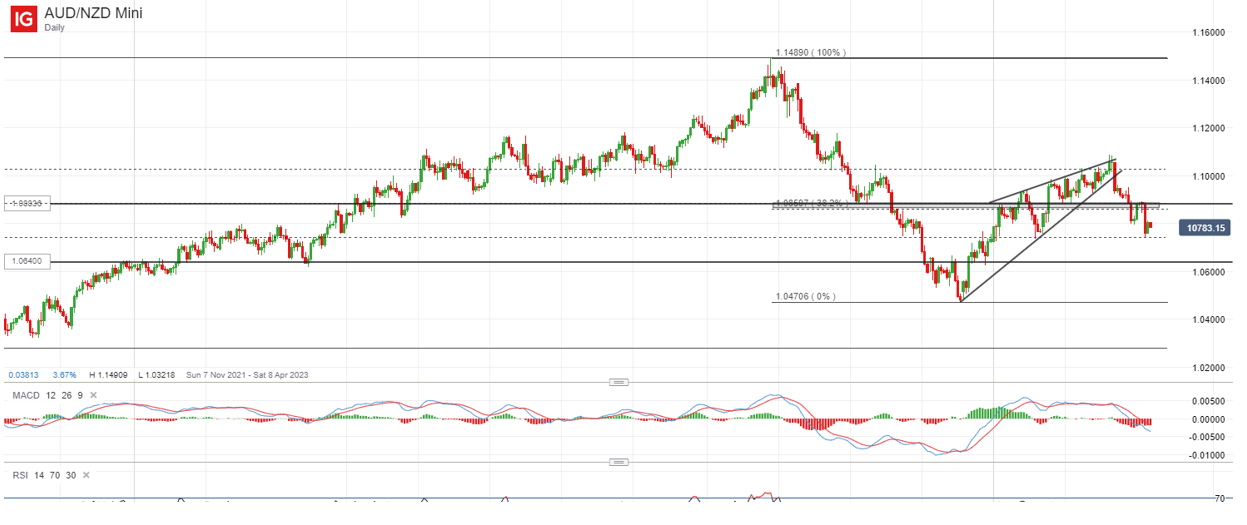
On the watchlist: AUD/NZD continues to display negative momentum
After breaking below a rising wedge pattern in late-February, AUD/NZD has retraced close to 3%, failing to defend both its 50-day and 100-day MA. Its Moving Average Convergence/Divergence (MACD) has headed back into negative territory, reflecting some bearish momentum in place. For now, the January 2023 lows are being tested at the 1.074 level. Failure for the line to hold may pave the way towards the 1.064 level, where a previous resistance-turned-support stands in place.
 Source: IG charts
Wednesday: DJIA -0.18%; S&P 500 +0.14%; Nasdaq +0.40%, DAX +0.46%, FTSE +0.13%


0 Comments
Recommended Comments
There are no comments to display.
Create an account or sign in to comment
You need to be a member in order to leave a comment
Create an account
Sign up for a new account in our community. It's easy!
Register a new accountSign in
Already have an account? Sign in here.
Sign In Now