Wall Street rally post-NFP: What to watch for Nasdaq 100, AUD/JPY, AUD/USD?

Entry posted by MongiIG in Market News
412 views
US equity market took the chance to rally following US non-farm payroll data, with the extreme bearish positioning among large speculators providing the stage for some shorts unwinding.
 Source: Bloomberg
Market Recap
To end last week, an upside surprise in the US April non-farm payrolls (253,000 versus 180,000 expected) was partly mitigated by downward revisions to previous months, which provides a resilient but more lukewarm picture for the US labour market. Wage pressures remain persistent, with average hourly earnings up 0.5% from the previous month (expected 0.3%). Year-on-year, US wage growth is at 4.4% versus 4.2% expected.
However, given that the labour market is usually the last shoe to drop in a downturn, the prevailing downside risks to growth outlook and continued pressures in the banking industry have left rate expectations to be largely undeterred. An upcoming rate pause from the Federal Reserve (Fed) remains the consensus, with 75 basis-point worth of rate cuts being priced. The US equity market took the chance to rally (DJIA +1.65%; S&P 500 +1.85%; Nasdaq +2.25%) and extreme bearish positioning among large speculators (from the latest CFTC data) may provide the stage for some shorts unwinding.
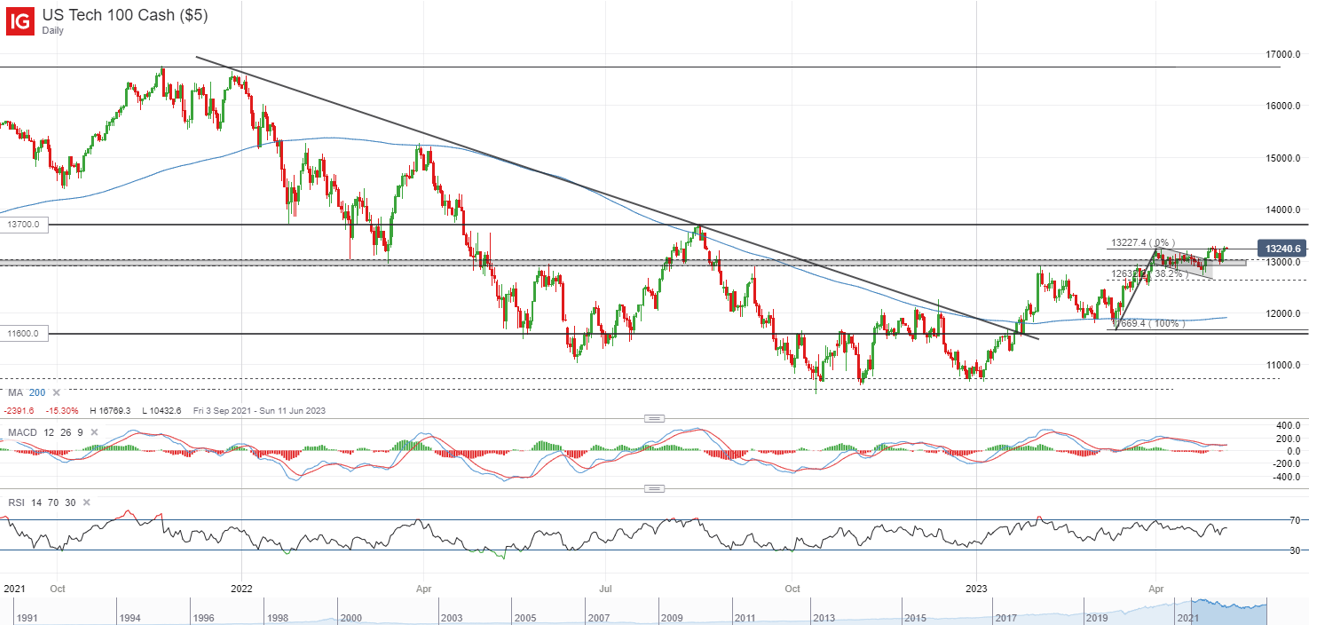
Ahead this week, risks to the US banking sector and debt ceiling stays unresolved, but the US Consumer Price Index (CPI) provides a catalyst for market participants to shift some focus to. The bullish flag formation for the Nasdaq 100 index remains intact thus far, with the recent upmove coming off a retest of its key 13,000 level of support. That could leave the August 2022 high at the 13,700 level on watch next. Gold prices came off its one-year high, but buyers were eager to defend its key psychological US$2,000 level, providing a mixed view in the near term. The US dollar continues to hover near its one-year low, with the bulls clearly exhausted despite the higher Treasury yields.
 Source; IG charts
Asia Open
Asian stocks look set for a mixed open, with Nikkei -0.41%, ASX +0.74% and KOSPI +0.76% at the time of writing. Japan market is back online after its three-day holiday break, greeted by the release of the Bank of Japan (BoJ) monetary policy meeting minutes to start the new trading week.
While upside risks to inflation were flagged, avoiding a premature shift in policies remains the strong consensus among policymakers, anchoring current rate expectations in pricing out any hikes for at least the next three policy meetings. Aside, Japan services Purchasing Managers' Index (PMI) continues to ride on reopening efforts to deliver a record pace in April, but weaker external demand on its manufacturing sector will likely keep its overall recovery bumpy.
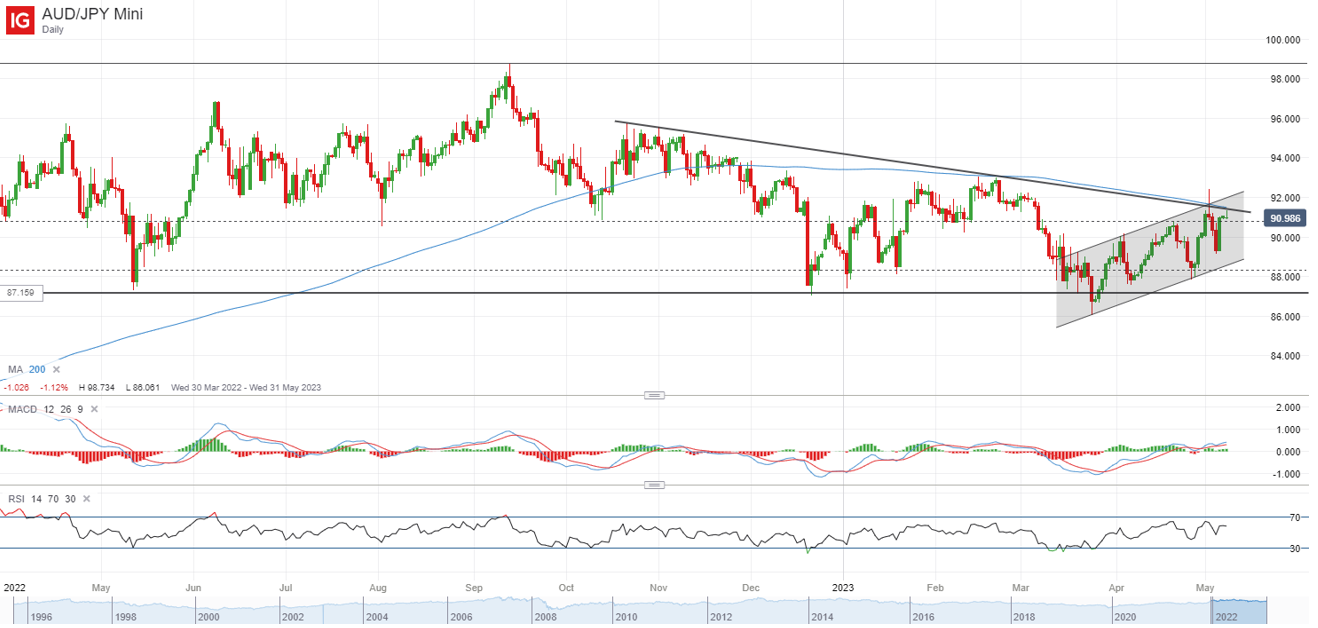
For the AUD/JPY, it is back to retest a key downward trendline resistance once more, which stands close to its key 200-day moving average (MA). Previous attempt for a break above its 200-day MA last week was met with the formation of a bearish shooting star, which provides testament to heavy resistance at the MA line for the bulls to overcome. Failure to cross the resistance could leave the 89.30 level on watch for any formation of a higher low, where a lower channel trendline support stands.
 Source: IG charts
On the watchlist: AUD/USD eyeing its 100-day MA resistance once more
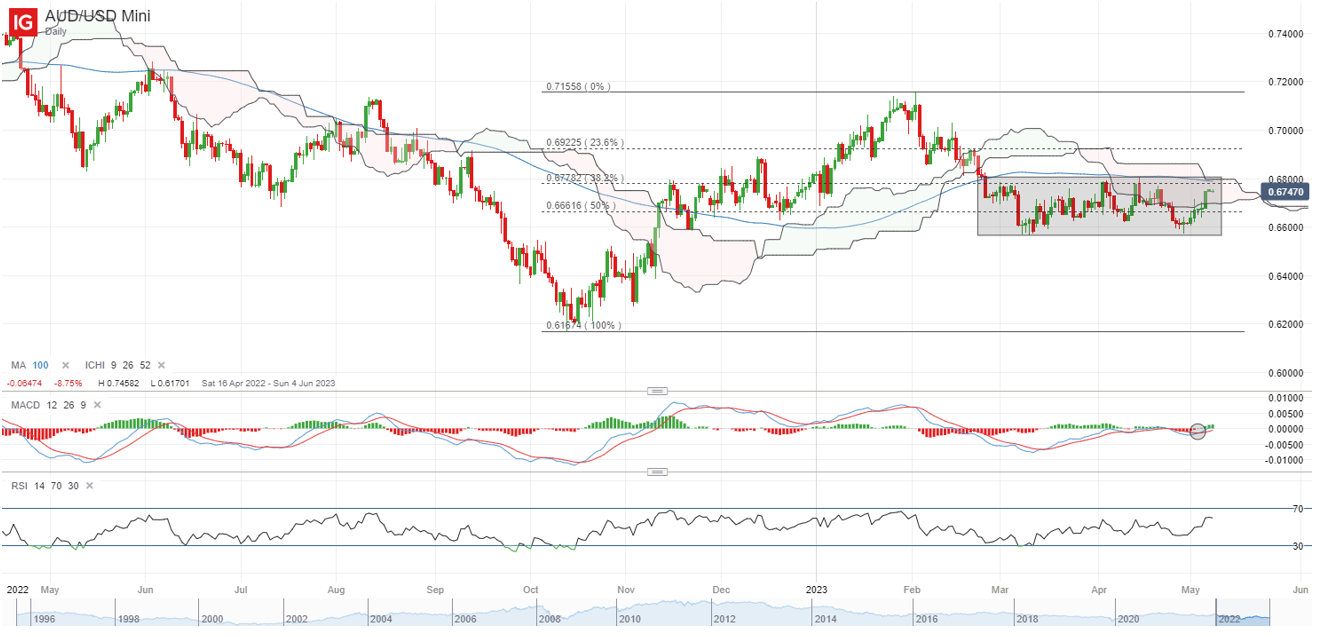
The hawkish takeaway from the Reserve Bank of Australia (RBA) last week has prompted an upmove in the AUD/USD, putting the pair en route to retest a key resistance confluence at the 0.680 level. With the key MA-line keeping the pair down on three previous occasions over the past two months, a successful attempt in overcoming the level will mark greater control for the bulls. The level also coincides with the upper edge of the Ichimoku cloud on the daily chart, which provides a potential reckoning for the overall trend ahead. This week, the pair may be sensitive to global risk sentiments, with any move to its two-month high potentially putting the 0.691 level on watch next.
 Source: IG charts
Friday: DJIA +1.65%; S&P 500 +1.85%; Nasdaq +2.25%, DAX +1.44%, FTSE +0.98%


.jpeg.98f0cfe51803b4af23bc6b06b29ba6ff.jpeg)


0 Comments
Recommended Comments
There are no comments to display.
Create an account or sign in to comment
You need to be a member in order to leave a comment
Create an account
Sign up for a new account in our community. It's easy!
Register a new accountSign in
Already have an account? Sign in here.
Sign In Now