Wall Street: US debt ceiling concerns weigh on markets as X-date approaches

Entry posted by MongiIG in Market News
877 views
The uncertainty created by the debt ceiling has played a part in the lack of movement in the S&P 500; the Nasdaq has seen fresh cycle highs and the Dow Jones could see a deeper decline towards support at 32,800.
It was a soft end to last week as US indices closed lower on concerns around the impeding US debt ceiling, regional banking woes and as the University of Michigan surveys revived stagflation fears.
Of the three concerns mentioned, the US debt ceiling issues provide the most tail risk to markets.
What is the US debt ceiling?
The debt ceiling is the legislated amount of debt the US Federal Government can have outstanding.
In 1995/1996, the US government was shut down twice, for five days and 21 days, respectively, as negotiations over government spending reached a stalemate. Almost 1 million workers were furloughed.
Since 1960 the US debt ceiling has been lifted 78 times with the current debt ceiling limit of $31.4 trillion, originally set in 2021, being reached in January 2023.
In recent months, the Treasury has been using extraordinary measures to help the government continue to pay its bills.
X-date
The “X-date”, which is the date when the government can no longer pay its bills, is rapidly approaching. The Department of Treasury estimates the X-date to be June 1; however, with special measures, i.e., short-term fixes and compromise, the X-date might be drawn out until late July or even September.
“It is impossible to predict with certainty the exact date when Treasury will be unable to pay the government’s bills,” Secretary Yellen told Speaker McCarthy.
What happens next?
Most expect the debt limit will be raised before a technical default. However, a quick resolution is unlikely, and if the X-date is crossed, it would be the first time the US has defaulted on its debt.
In 2011, Congress agreed to increase the debt ceiling just two days before the X-date and soon after, Standard and Poor’s cut the US credits rating to AA+ from AAA. The US dollar tanked, the S&P 500 fell 19%, while Treasuries rallied on risk aversion flows.
Last Tuesday’s meeting between US President Joe Biden and Congressional leadership, including House Speaker Kevin McCarthy, unsurprisingly found no agreement. Talks scheduled for last Friday night were postponed until this week.
Evidence that negotiations are underway has thus far provided little comfort to markets. The 1Y US Credit Default Swap (CDS protects against a borrower’s default) trades at a record high of 177 bp.
As a way of comparison, it reached as high as 80 in 2011.
S&P 500 technical analysis
The uncertainty created by the debt ceiling has played a part in the S&P 500’s lack of movement since our update last week.
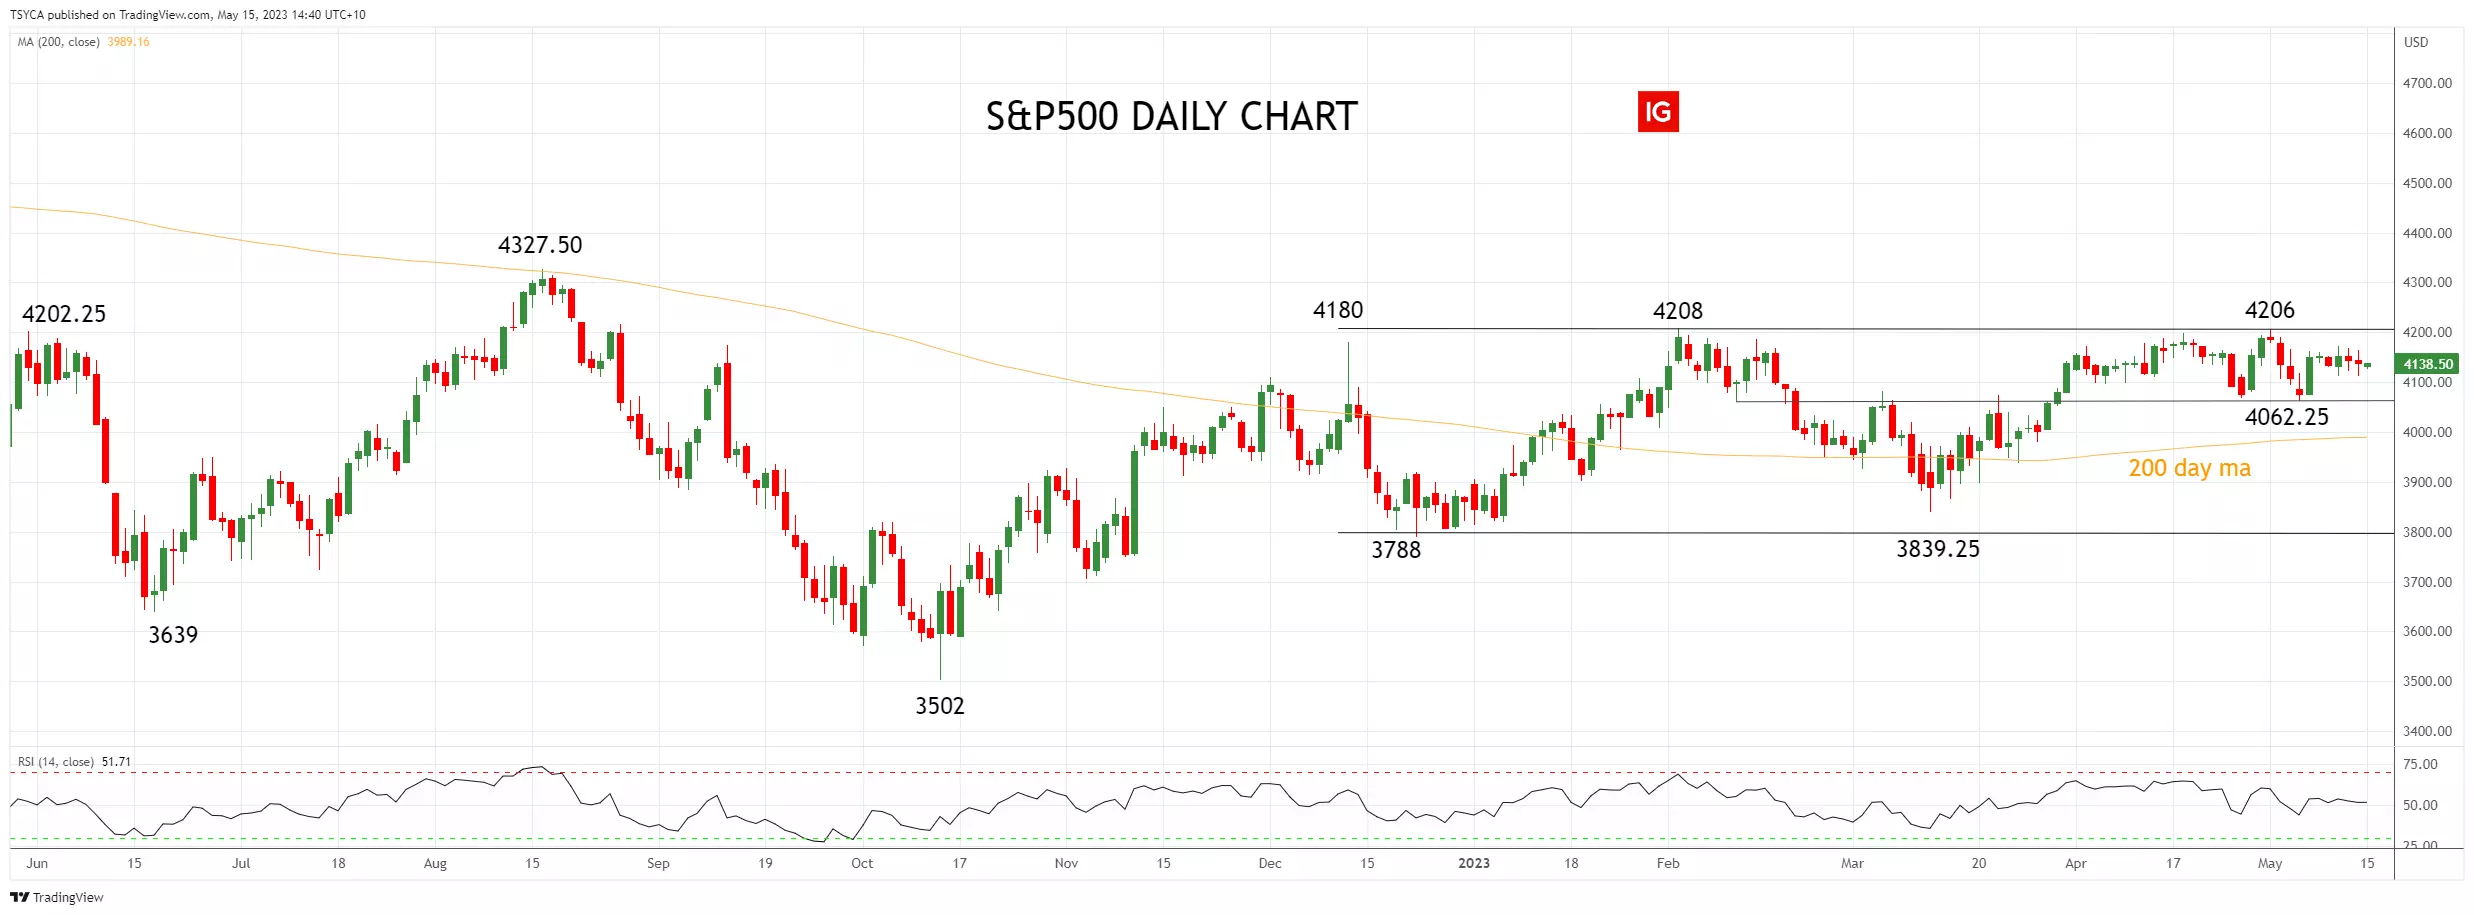
While the S&P 500 remains above 4070/60, a retest of range highs 4200/10 is likely. Aware that should there be a sustained break above 4210 (three daily closes above), it would put the August 4327 high on the market’s radar.
To re-energise the downside, the S&P 500 needs to remain below 4210 and then see a sustained break below 4070/60 which would bring into play 4000 and then 3800.
S&P 500 daily chart
 Source: TradingView
Nasdaq technical analysis
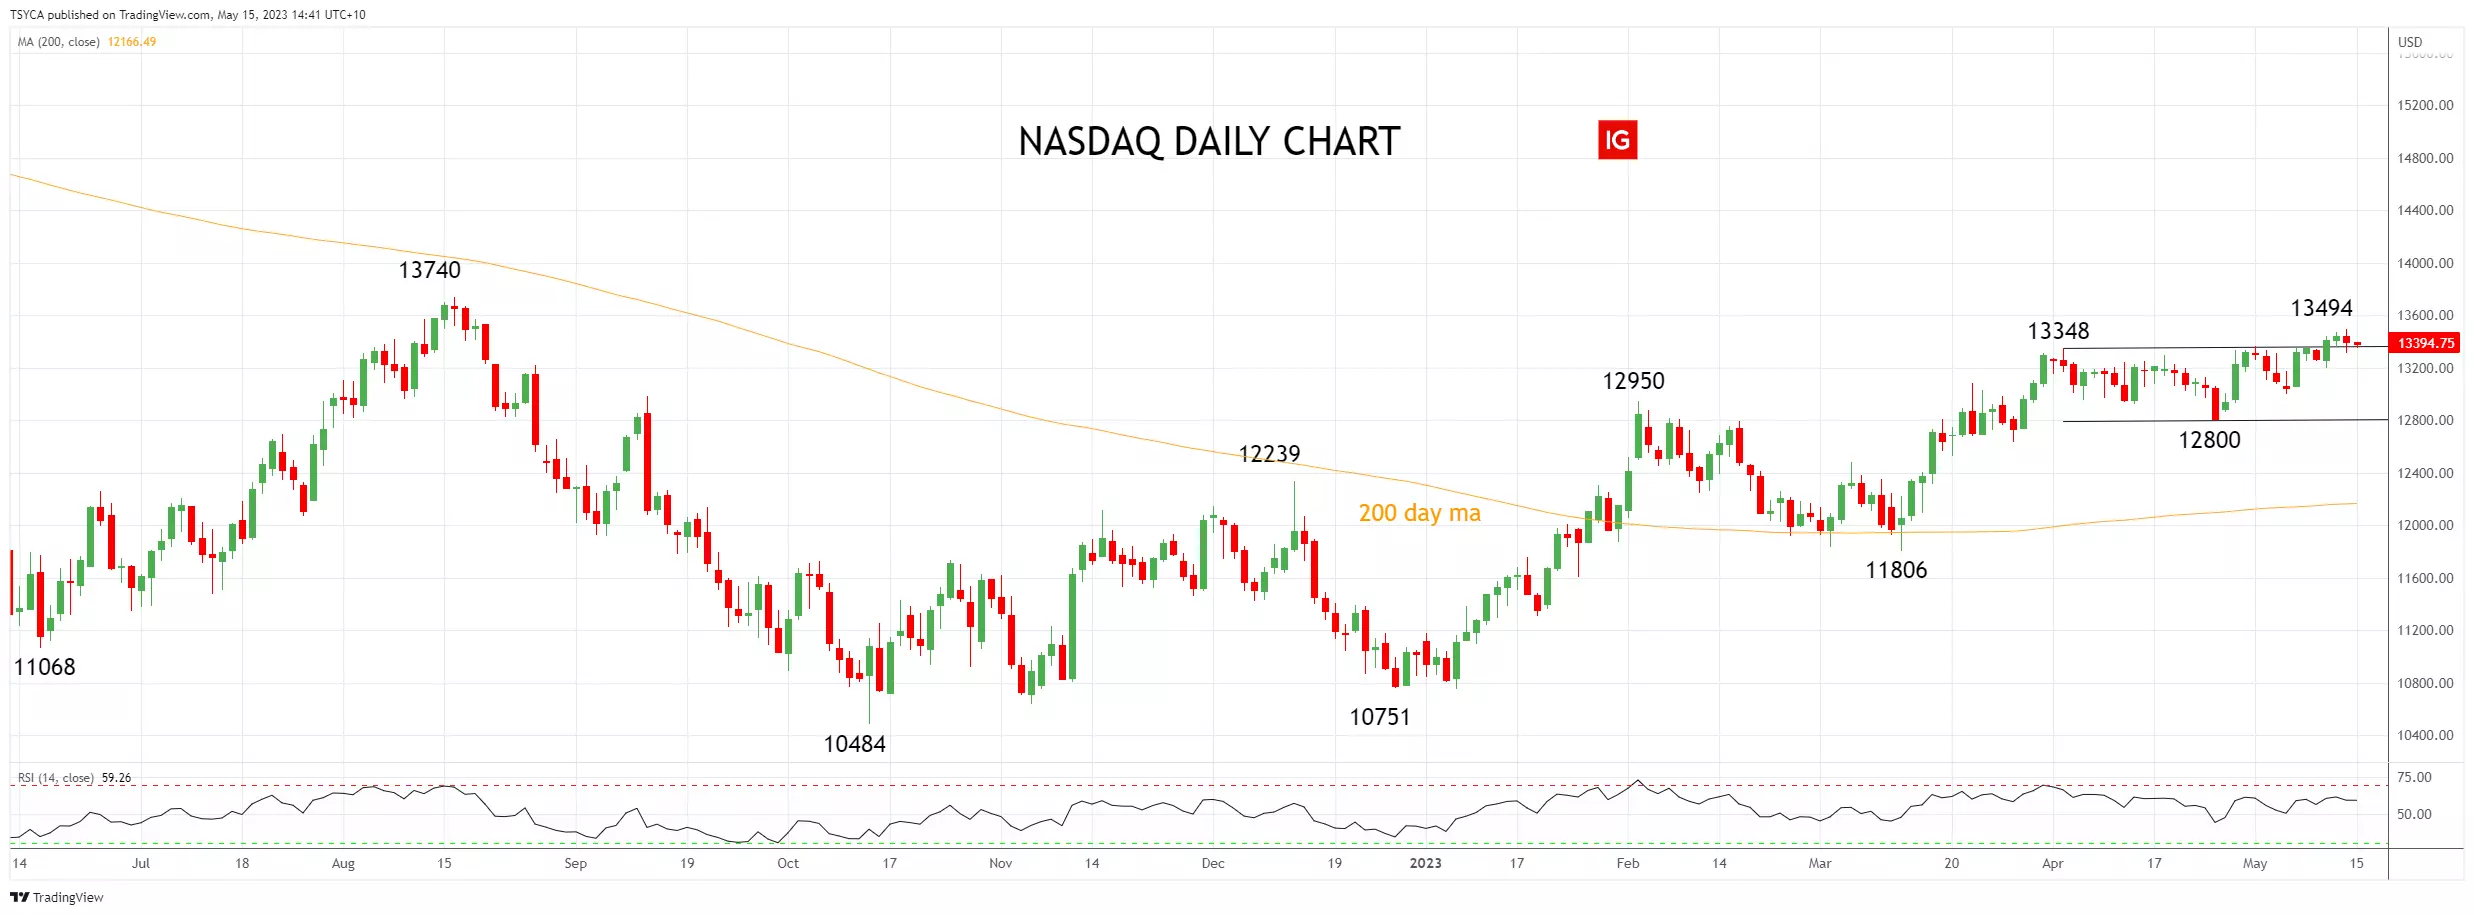
There were fresh cycle highs for the Nasdaq last week as it traded to its highest level since August 2022. Providing the Nasdaq can hold above support formerly resistance at 13,350/13,200, a retest of the August 13,740 high is possible.
Aware that if the Nasdaq saw a sustained break of support at 13,350/13,200, it would warn that a deeper pullback is underway towards 12,800. A break of 12,800 would then see downside risks, initially towards the 200-day moving average at 12,163.
Nasdaq daily chart
 Source: TradingView
Dow Jones technical analysis
The Dow Jones brief break higher at the end of April was upended by the latest episode of the US banking crisis after PacWest Bancorp, reported a drop in deposits during the first week of May. PacWest Bancorp shares ended last week 21% lower at $4.55 and are down 55% in May.
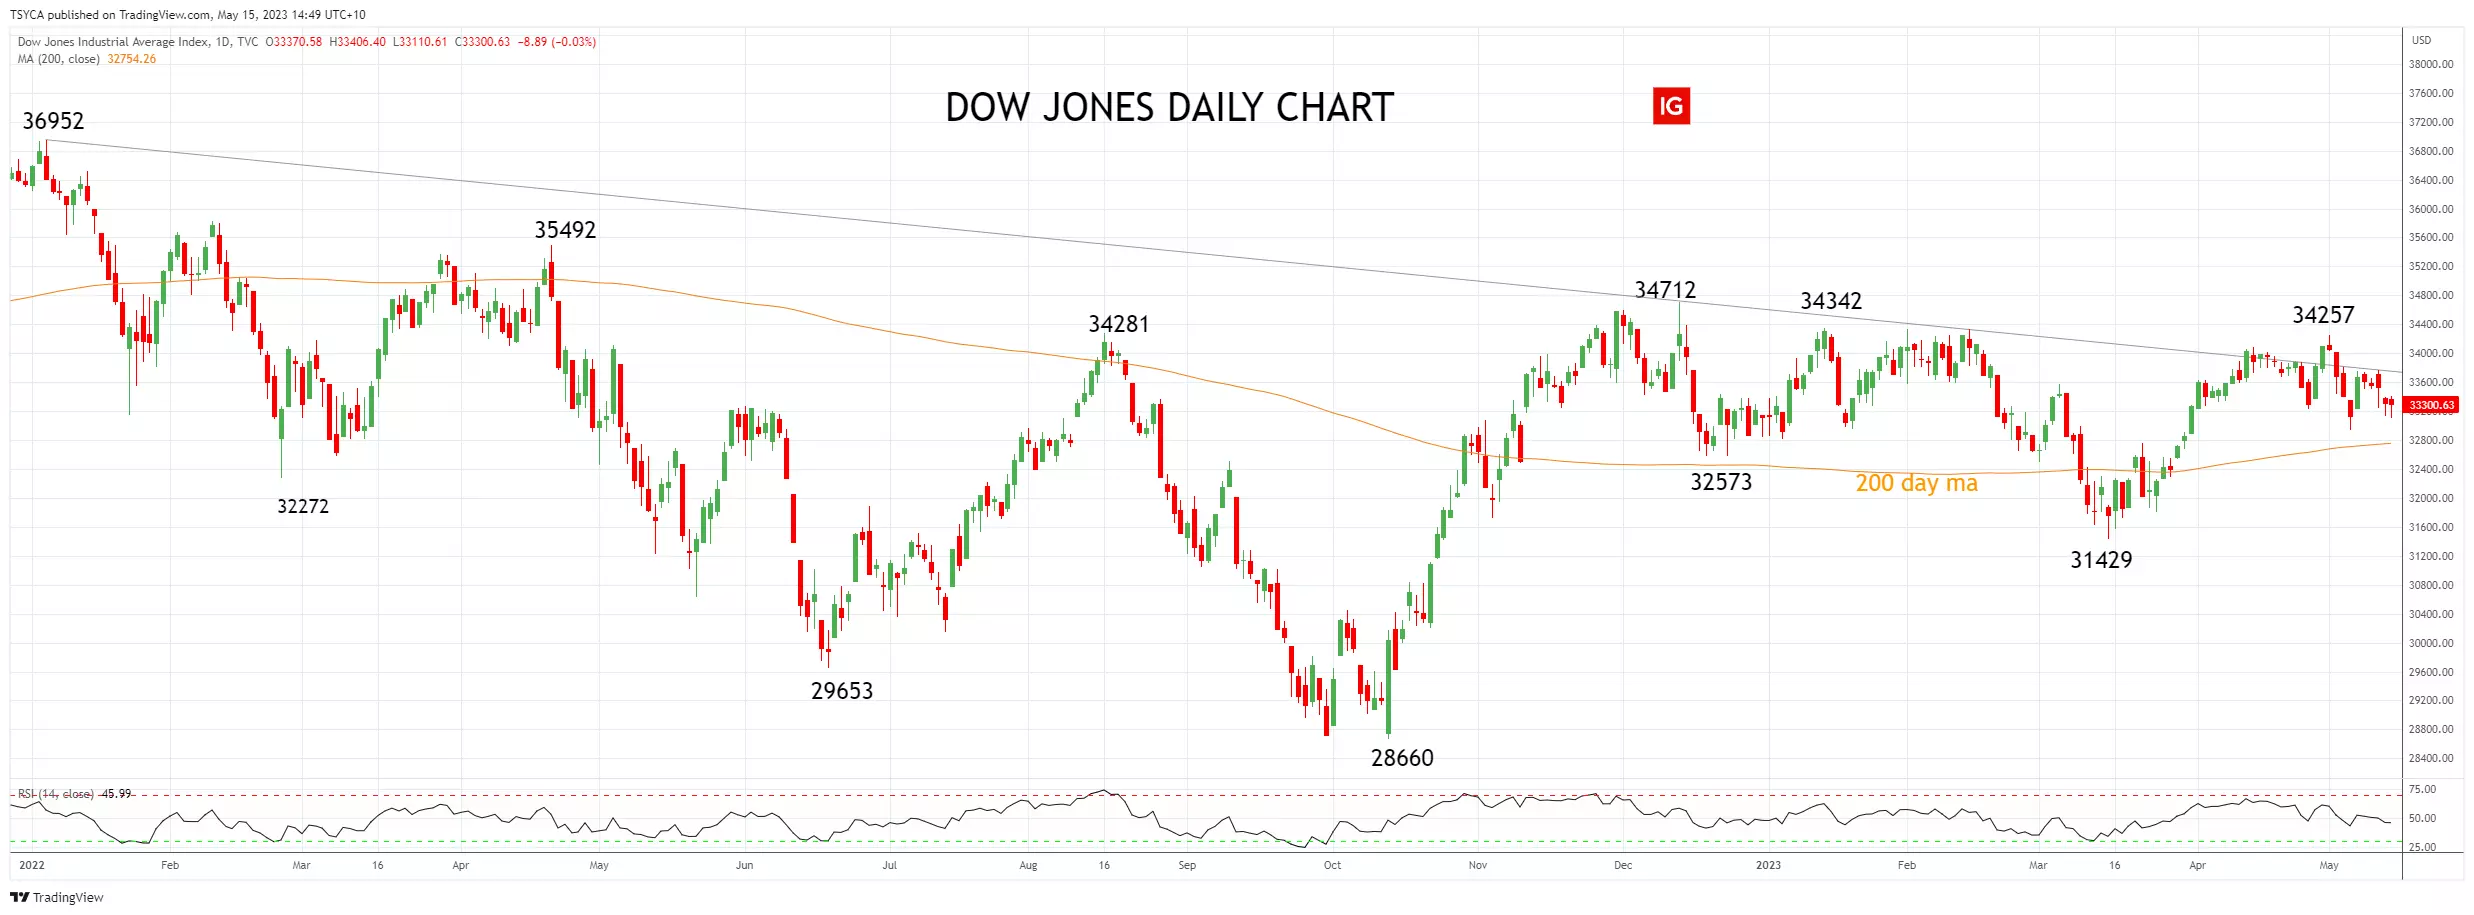
If the Dow Jones can take out the recent 34,257 high and the 34,342 year-to-date high, it would re-energise the upside and open a test of the 34,712 high from December 2022 with scope to the 35,492 high from April 2022.
Until then, allow for a deeper decline to unfold towards support at 32,800, coming from the 200-day moving average with scope to year-to-date lows at 31,429.
Dow Jones daily chart
 Source: TradingView
- TradingView: the figures stated are as of May 15, 2023. Past performance is not a reliable indicator of future performance. This report does not contain and is not to be taken as containing any financial product advice or financial product recommendation.


1 Comment
Recommended Comments
Create an account or sign in to comment
You need to be a member in order to leave a comment
Create an account
Sign up for a new account in our community. It's easy!
Register a new accountSign in
Already have an account? Sign in here.
Sign In Now