Debt ceiling crisis: will it find a solution before X-date?

Entry posted by MongiIG in Market News
625 views
Debt ceiling talks have dominated the sentiment since early May. With the "X-date" fast-approaching, what could be the impact on investment markets?
 Source: Bloomberg
Debt ceiling talks have dominated the sentiment since early May. Recently, US Treasury Secretary Janet Yellen warned again that it’s "highly likely" her department will run out of cash, potentially leading to a debt default as early as June 1st. With the "X-date" fast-approaching, what could be the impact on investment markets?
What are the debt ceiling and ‘X-date’?
The debt limit, also known as the debt ceiling, refers to the maximum amount of money that the United States government is authorized to borrow in order to fulfill its legal obligations. These obligations include various payments such as Social Security and Medicare benefits, military salaries, interest on the national debt, tax refunds, and other necessary expenditures. The X-date is a critical point at which the government's available funds may no longer be sufficient to meet these financial obligations.
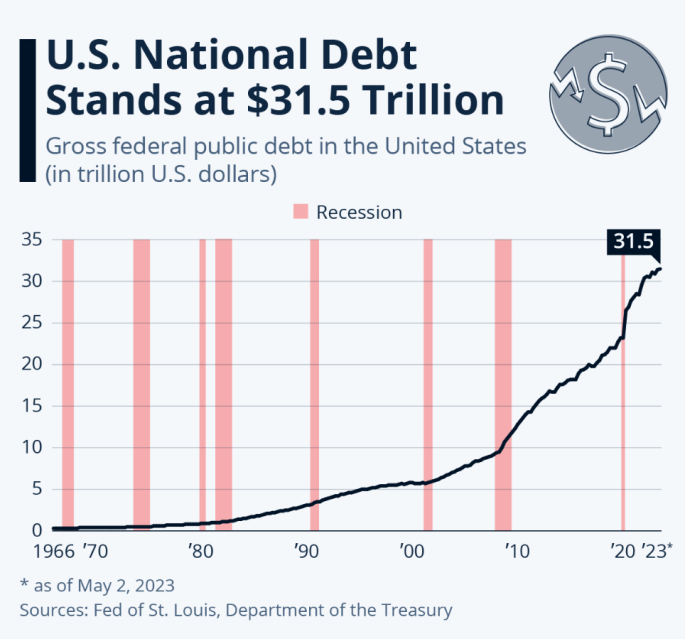
At time of writing, the national debt of the US Federal Government stands at approximately $31.46 trillion. It's worth noting that the current debt limit is set at around $31.4 trillion.
That is to say, without raising or suspending the debt limit, the US Treasury would be unable to borrow additional funds once its available cash runs out.
The impact of a potential default?
The failure of the US government to meet its financial obligations by the X-date would have far-reaching ramifications.
Directly, the shortage of available funds would force the US government to make difficult choices, such as cutting Social Security payments or reducing payrolls. These painful measures would inevitably present significant obstacles to the long-term stability of US society and the effective functioning of public institutions.
In the financial market, the ripple effect of a debt limit crisis would likely result in reduced liquidity and higher borrowing costs. Fitch Ratings has projected that in the event of a default, the credit rating of the US would be graded as a "Restricted Default" status, and all relevant Treasury securities would be downgraded to a "D" rating.*
Furthermore, the projected deterioration in economic conditions following a default would pose a threat to financial stability and greatly increase the likelihood of a financial crisis. According to estimates from the White House, the impact of a debt default would be felt across nearly every aspect of the economy. For instance, a protracted default could possibly lead to a 5% increase in the unemployment rate. Moreover, the real GDP growth would be significantly hindered, potentially leading to a deep recession.
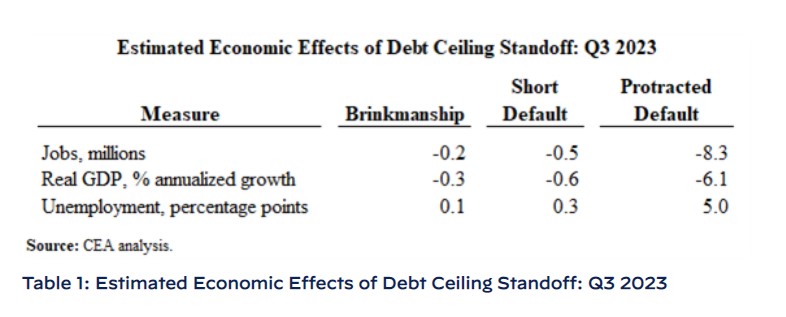 Source: The White House website: https://www.whitehouse.gov/cea/written-materials/2023/05/03/debt-ceiling-scenarios/
Is it possible to resolve the debt limit crisis before the X-date?
Generally, as the X-date approaches, there is typically heightened pressure on lawmakers to find a solution to avoid defaulting on the government’s financial obligations. This pressure should motivate the relevant parties to reach a compromise and raise or suspend the debt limit.
It’s also worth noting that, since 1960, the US Congress has raised the debt limit 78 times to ensure the government's ability to meet its financial obligations. The most recent lift of the debt limit occurred in December 2021.
According to a poll conducted among the IG analyst team, 91% of the voters believe that a deal could be reached in the debt ceiling negotiations before June 1st.
However, we shouldn’t underestimate the impact of a prolonged debt crisis talk. The longer the negotiation process drags on without a clear resolution, the greater the potential for market disruptions and investor anxiety.
The impact on different asset groups
-
US Dollar
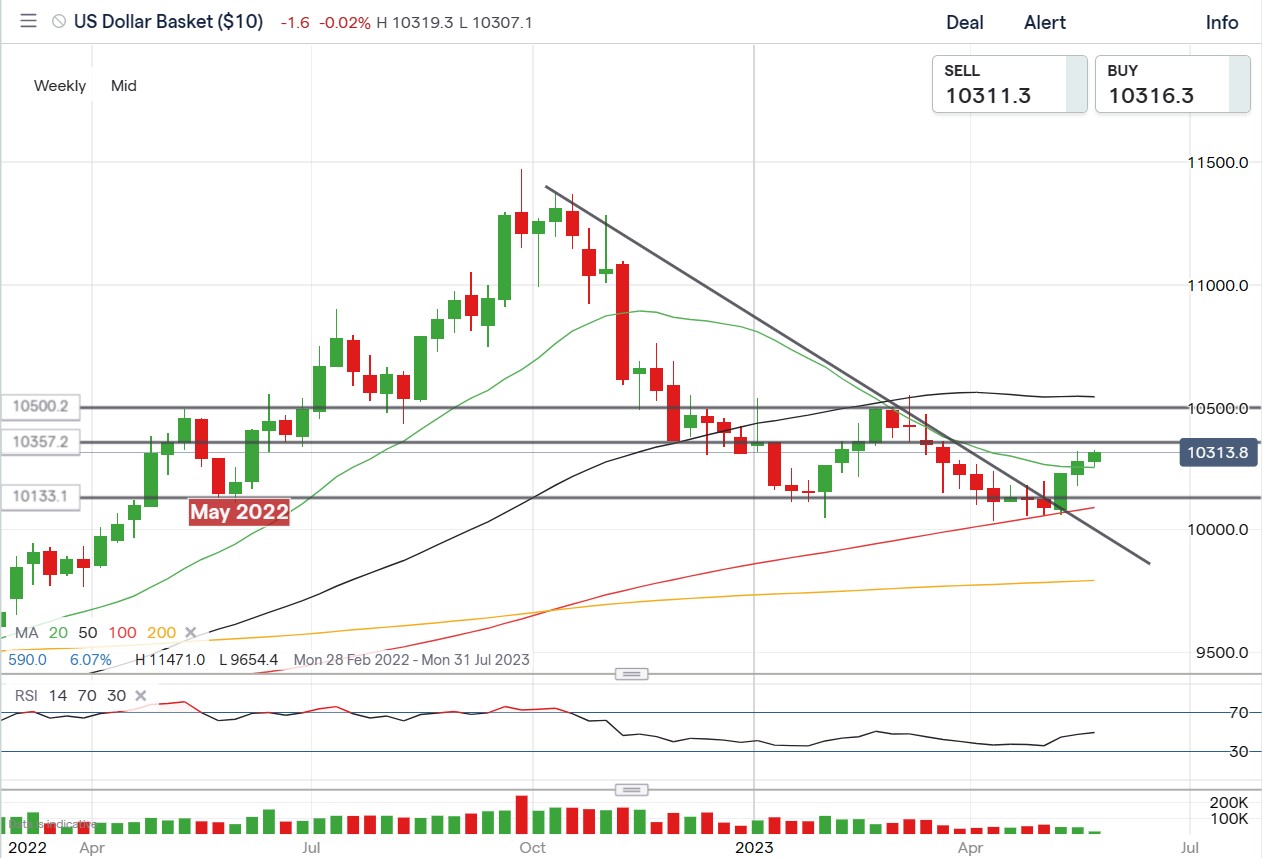
The potential debt default would have a swift impact on the US Dollar, raising concerns about the US government's financial stability. Additionally, if the economic outlook deteriorates in the aftermath of such an event, the US central bank may need to adjust its current tightening policy. Both of these scenarios would lead to a significant weakening of the greenback when compared to other currencies.
Looking at the weekly chart, it’s evident that the US dollar has regained its strength over the past three weeks, finding support from the 20-week moving averages. The forthcoming challenge will be the November low at approximately 103.57 before targeting the February high near 105. In the event of any pullbacks, the May low around 101.33 can be viewed as a critical mid-term support level.
-
US Stocks
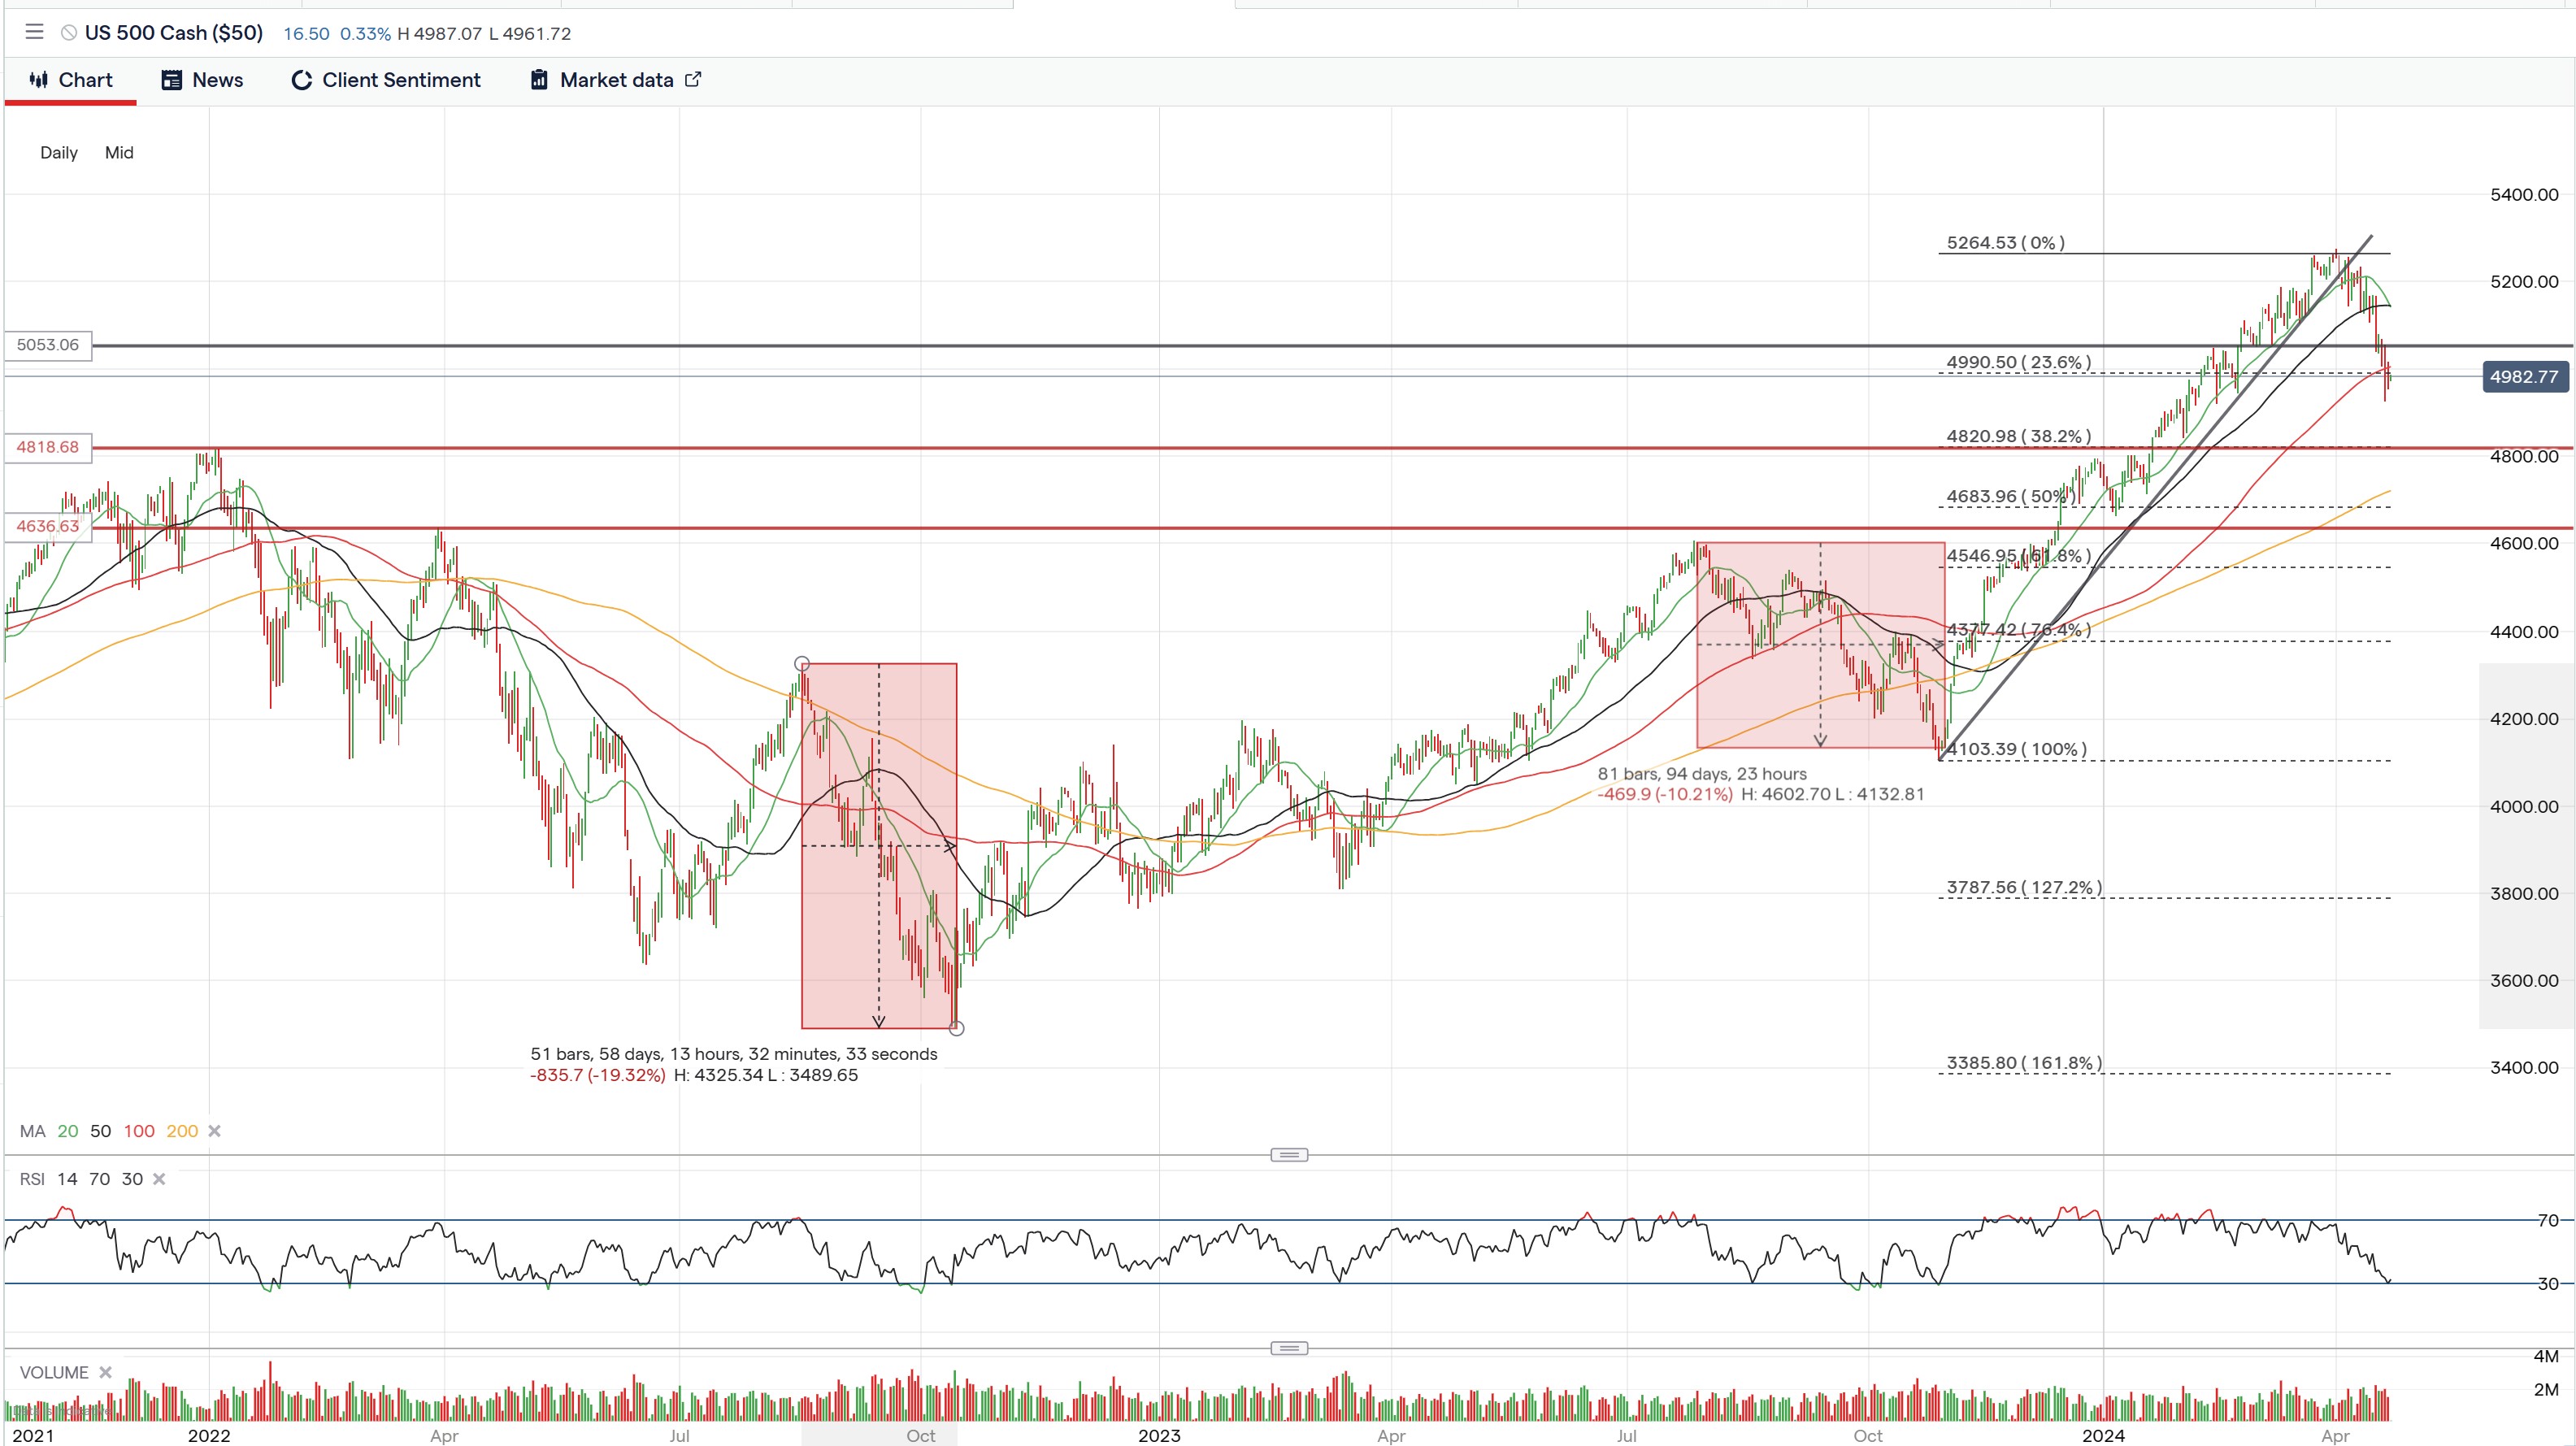
Both a prolonged debt limit crisis or a default would undermine investors’ confidence and risk appetite. During such periods, risk-averse traders are likely to adjust their investment, which could cause fluctuations in the stock market.
From a technical analysis viewpoint, the S&P500 is currently approaching a significant resistance level. The August high at 4200 continues to be a substantial challenge for the index. However, it’s important to note the overall trend remains bull-biased as both the mid-term trend line (March to May) and the longer-term line from October are pointing upward. In terms of immediate support, attention can be given to the 20-day moving average as a potential level of support.
-
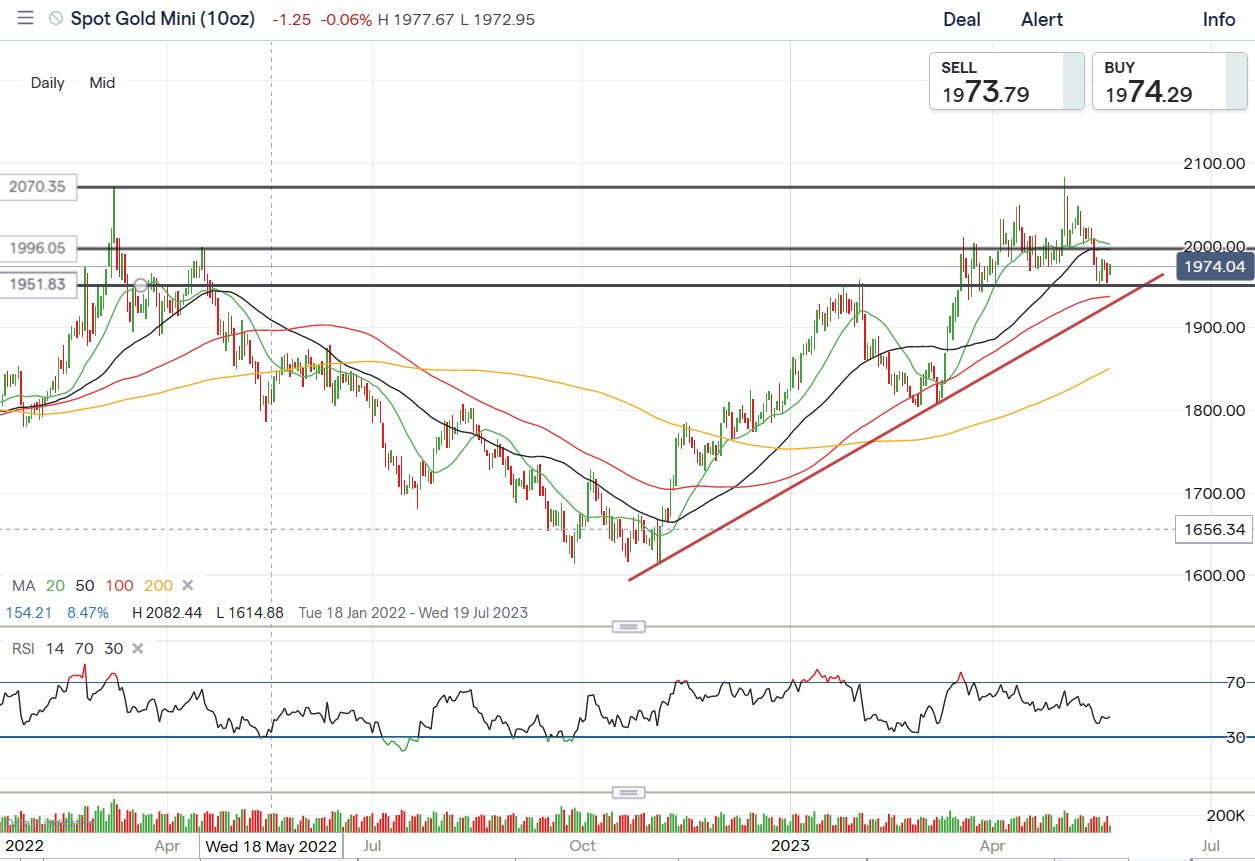
Gold
Precious metals such as gold are often viewed as safe haven assets during periods of economic and financial instability, and investors may turn to gold as a store of value and a hedge against potential losses in other assets. Additionally, the weakening of the US dollar – as discussed above – could spark extra shine on the yellow metal.
The price of gold has recently pulled back from its peak of $2082, breaching the $2000 psychological level in the past week. The current support level appears to be around $1951, which coincides with the February high. On the other hand, the current conjunction point of the 20-day and 50-day moving averages could act as a near-term resistance level.


0 Comments
Recommended Comments
There are no comments to display.
Create an account or sign in to comment
You need to be a member in order to leave a comment
Create an account
Sign up for a new account in our community. It's easy!
Register a new accountSign in
Already have an account? Sign in here.
Sign In Now